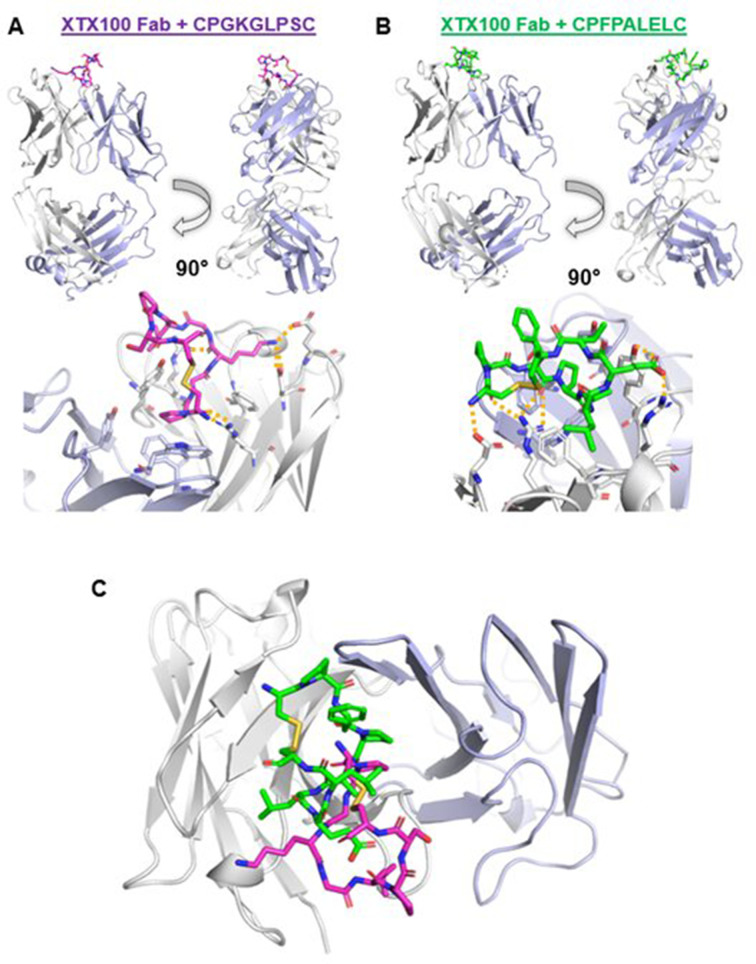
Figure 2.
Crystallographic data of peptide:Fab complexes. (A) Crystal structure of XTX100Fab in complex with CPGKGLPSC. Fab light and heavy chains are shown in blue and white, respectively, and peptide is shown in magenta. Key interactions shown with yellow dash lines. (B) Crystal structure of XTX100Fab in complex with CPFPALELC. Fab light and heavy chains are shown in blue and white, respectively, and peptide is shown in green. (C) Mutual superposition of CPGKGLPSC (magenta) and CPFPCALELC (green) in complex with XTX100Fab.

