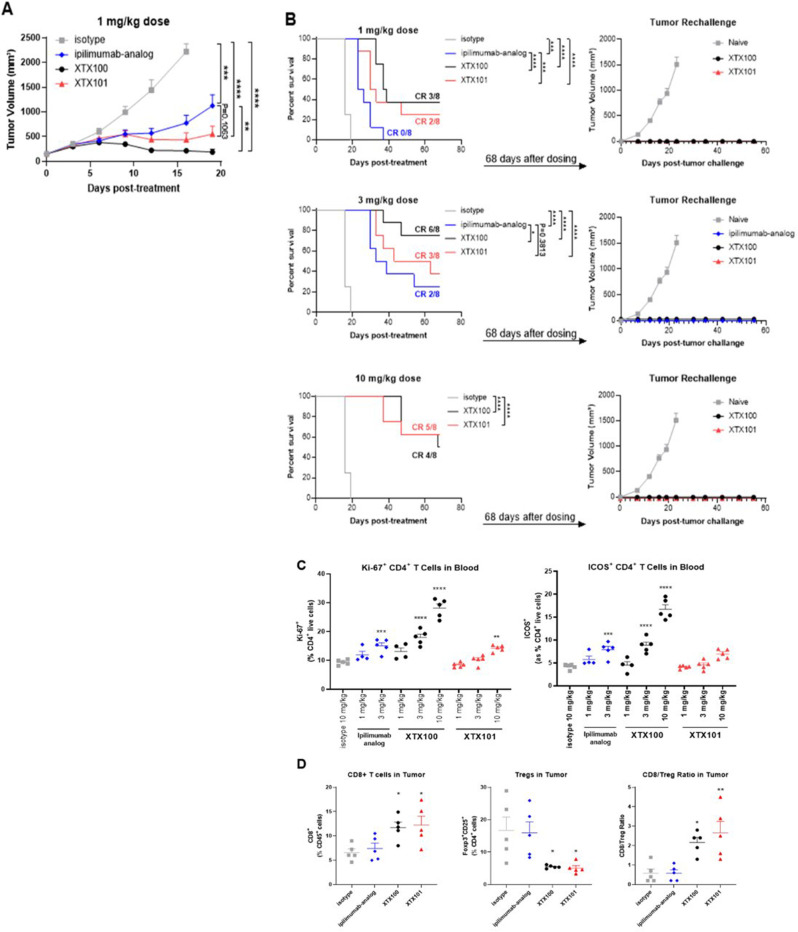
Figure 5.
XTX101 monotherapy in MB49 tumor model. (A–C) For the TGI study, B-hCTLA-4 mice bearing syngeneic MB49 murine bladder carcinoma tumors (~150 mm3) were treated intravenously with a single dose of XTX100 (black), XTX101 (red), ipilimumab-analog (blue), or isotype (gray) mAb at indicated dose levels (n=8 per group). (A) Tumor volume was measured twice weekly and plotted as mean±SEM TGI from 1 mg/kg dose groups shown. Online supplemental figure 5 shows TGI from 3 and 10 mg/kg dose groups. (B) Survival curves with number of CR indicated from initial study (left), and tumor volume curves plotted as mean±SEM from tumor rechallenge study (right) for indicated dose cohorts. (C) Immunophenotypic analyses of CD45+ CD3+ CD4+ T cells in the peripheral blood, 5 days post-dose. (D, E) For the tumor pharmacodynamics study, B-hCTLA-4 mice bearing syngeneic MB49 murine bladder carcinoma tumors (~350 mm3) were treated intravenously with a single dose of XTX100 (black), XTX101 (red), ipilimumab-analog (blue), or isotype (gray) mAb at 3 mg/kg (n=5 per group). Immunophenotypic analyses by flow cytometry of live CD45+ CD3+ CD4+ Foxp3+ Tregs and live CD45+ CD3+ CD8+ T cells from spleens (D) and tumors (E) were measured on day 7. *p<0.05; **p<0.01; ***p<0.001; ****p<0.0001, compared with isotype control. TGI, tumor growth inhibition; Tregs, regulatory T cells.

