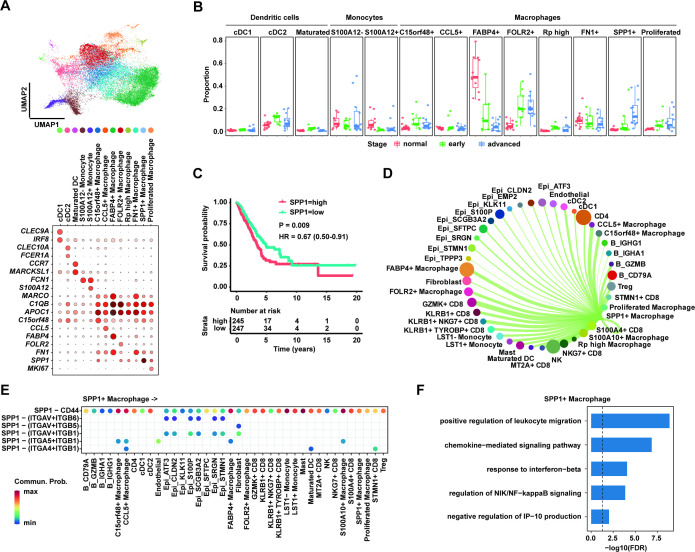
Figure 3.
SPP1+ macrophages enriched in advanced lung adenocarcinoma (LUAD). (A) Uniform manifold approximation and projection (UMAP) plot of 13 subpopulations of myeloid cells including three clusters of dendritic cells, two clusters of monocytes and eight clusters of macrophage cells (upper panel). Dot plot showing expression levels of specific markers in each cluster (lower panel). (B) Box plot showing the proportion of SPP1+ macrophages significantly increased in advanced LUAD compared with normal and early LUAD. (C) Kaplan-Meier survival analysis for two groups defined by patients in The Cancer Genome Atlas (TCGA)-LUAD cohort with high/low expression of SPP1. The sample numbers for each group are shown in brackets. Statistical significance is determined by log-rank test. (D) Circle plots showing putative ligand-receptor interactions between SPP1+ macrophages and other cell clusters, with the width of edges representing the strength of the communication. (E) The heatmap showing the interaction between SPP1 ligand in SPP1+ macrophages and six receptors of other clusters. Every row represents a ligand-receptor pair and every column defines a cell-cell interaction pair. (F) Gene Ontology pathway enrichment analysis of differential gene expression (log2 fold change ≥0.25 or ≤0.25 and FDR ≤0.05) between SPP1+ macrophage cells and the rest of macrophage cells.

