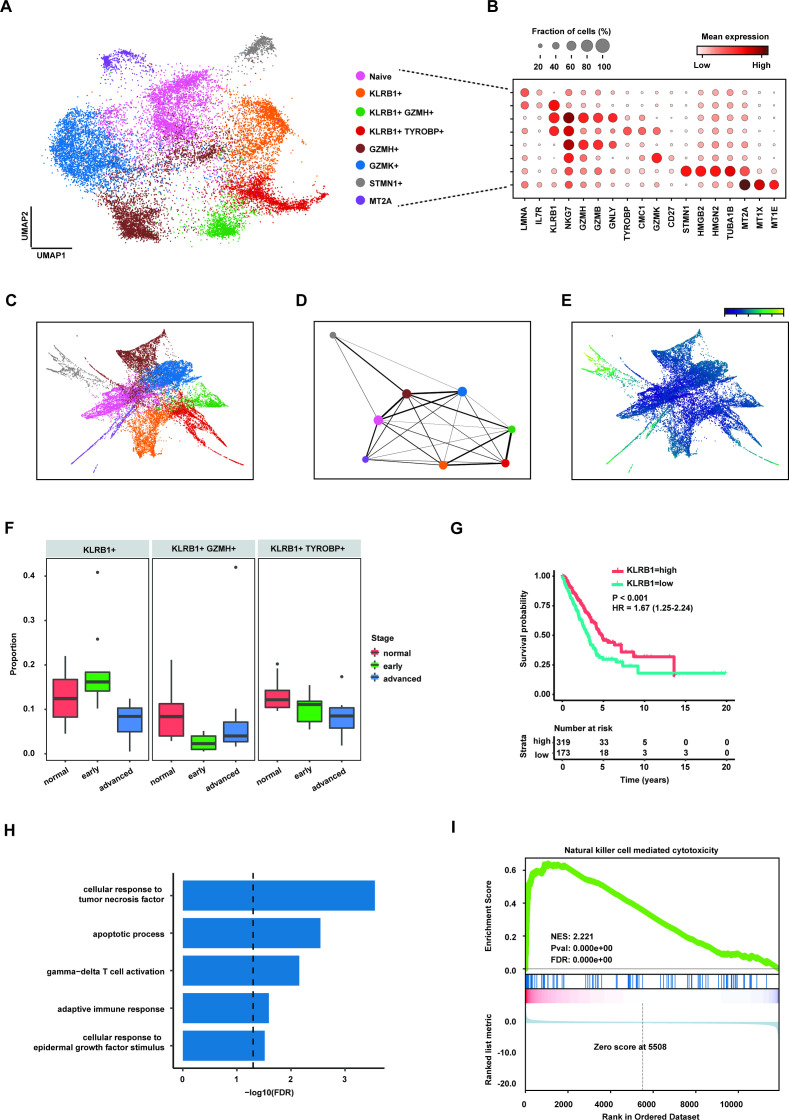
Figure 4.
CD8+KLRB1+ T cells decreased in advanced lung adenocarcinoma (LUAD). (A) Uniform manifold approximation and projection (UMAP) plot of subpopulations of CD8+ T cells. (B) Dot plot showing expression levels of specific markers in each CD8+ T subpopulation. (C) The partition-based graph abstraction (PAGA) embedding plot showing the trajectory inference of CD8+ T subpopulations. (D) PAGA graph showing the distribution of CD8+ T subpopulations. The width of line representing the connectivity adjacency between clusters. (E) Pseudotime plot of CD8+ T subpopulations. (F) Box plot showing the proportion of three CD8+KLRB1+ T cells in three stages of LUAD. (G) Kaplan-Meier survival analysis for two groups defined by patients in The Cancer Genome Atlas (TCGA)-LUAD cohort with high/low expression KLRB1. The sample numbers for each group are shown in brackets. Statistical significance is determined by log-rank test. (H) Gene Ontology pathway enrichment analysis of differential gene expression (log2 fold change (FC) ≥0.25 or ≤0.25 and FDR ≤0.05) between CD8+KLRB1+ T cells and the rest of CD8+ T cells. (I) Gene set enrichment analysis for the ranked gene lists according to FCs of gene expression in the CD8+KLRB1+ T cells compared with the rest of CD8+ T cells.

