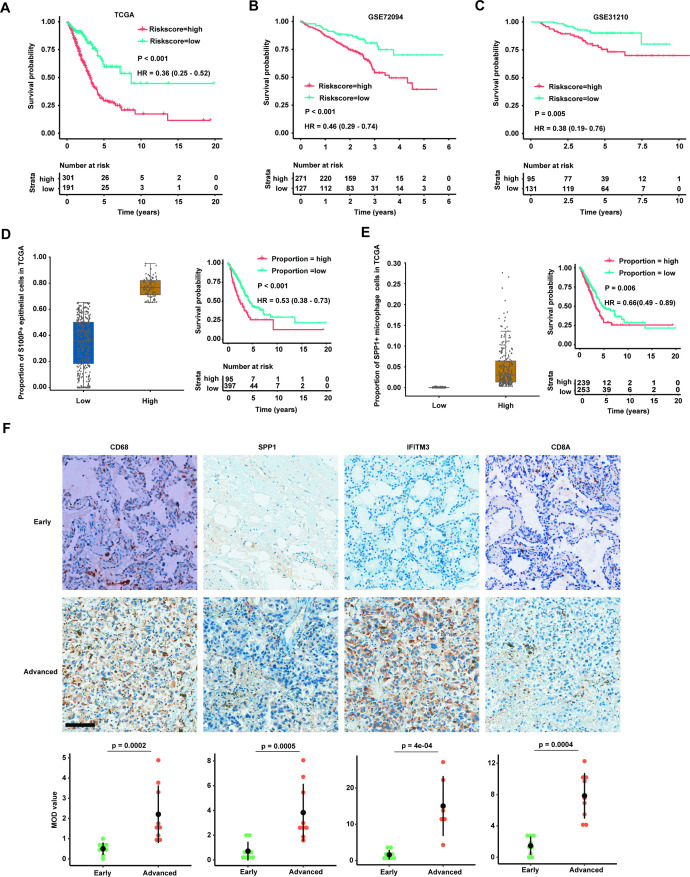
Figure 6.
Validation of marker genes for cell types by three independent bulk RNA-sequencing datasets and immunohistochemistry (IHC). (A) Kaplan-Meier survival analysis for two groups defined by patients in The Cancer Genome Atlas (TCGA)-LUAD cohort with high-risk/low-risk score. The sample numbers for each group are shown in brackets. Statistical significance is determined by log-rank test. (B) Kaplan-Meier survival analysis for two groups defined by patients in GSE72094 with high-risk/low-risk score. The sample numbers for each group are shown in brackets. Statistical significance is determined by log-rank test. (C) Kaplan-Meier survival analysis for two groups defined by patients in GSE31210 with high-risk/low-risk score. The sample numbers for each group are shown in brackets. Statistical significance is determined by log-rank test. (D) Patients with LUAD in TCGA cohort are divided into two groups based on the proportion of S100P+ epithelial cells estimated by deconvolution analysis (left panel). Kaplan-Meier survival analysis for two groups defined by patients in TCGA-LUAD cohort with high/low proportion of S100P+ epithelial cells (right panel). The sample numbers for each group are shown in brackets. Statistical significance is determined by log-rank test. (E) Patients with LUAD in TCGA cohort are divided into two groups based on the proportion of SPP1+ macrophage cells estimated by deconvolution analysis (left panel). Kaplan-Meier survival analysis for two groups defined by patients in TCGA-LUAD cohort with high/low proportion of SPP1+ macrophage cells (right panel). The sample numbers for each group are shown in brackets. Statistical significance is determined by log-rank test. (F) IHC staining of four marker genes (CD68, SPP1, IFITM3 and CD8A) in patients with early (upper panel) and advanced (middle panel) LUAD. The expression of four marker proteins (CD68, SPP1, IFITM3 and CD8A) are significantly increased in advanced stage compared with early stage (lower panel; n=18; scale bar=100 µm). Each IHC staining were replicated by six patients and three random regions of interest (ROI) for each marker per patient (total number=18) were selected for calculation. Mean optical density (MOD) is equal to the integrated optical density/measurement area.

