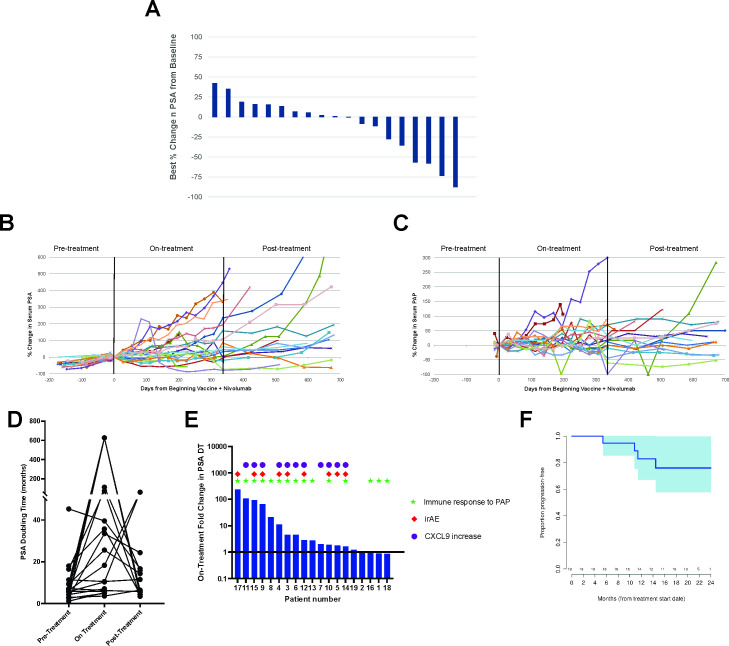
Figure 3.
Clinical evaluations. Serum PSA and PAP values were collected from all individuals prior to treatment (for PSA), over the course of treatment, and in the 1-year period off treatment. (A) Shown are the best percentage changes in serum PSA from day 1. Also shown are the individual plots over time of % change in serum PSA (B) or serum PAP (C) from the value obtained on day 1. (D) PSA doubling times for each patient were calculated from the values available up to 1 year prior to treatment, during the 1 year on treatment, and for the 1 year off treatment. (E) Fold change in PSA doubling time from pretreatment to on-treatment is displayed for each patient with symbols representing which patients developed an ELISPOT response at any post-treatment time point to PAP, which patients developed an immune-related adverse event (irAE), and which patients demonstrated an increase in serum CXCL9 at week 4 of treatment. (F) Shown is the time to radiographic progression. PAP, prostatic acid phosphatase; PSP, prostate-specific antigen.

