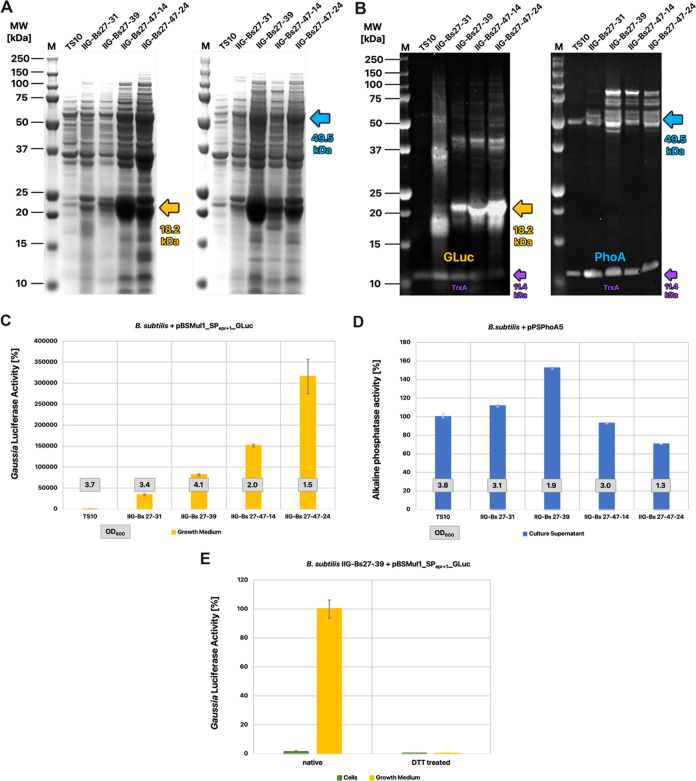
Figure 2.
Benchmark of different genome-minimized strains producing GLuc or PhoA. (A, B) Culture supernatant samples from four different genome-minimized B. subtilis strains and the reference strain TS10, producing either GLuc (18.2 kDa) or PhoA (49.5 kDa), were separated by LDS-PAGE and analyzed by Coomassie staining (A) or Western blotting with specific antibodies against GLuc or PhoA (B), respectively. In addition, both Western blots were analyzed with an antibody against the cytoplasmic TrxA protein (11.4 kDa), which serves as a reliable marker for cell lysis (B) (for the control blots without TrxA detection, see Supporting Figure S2). The samples were normalized to the OD600 of the respective strain. The arrows indicate the expected molecular size in kDa of the respective mature proteins. (C, D) Comparison of the enzymatic activities of GLuc and PhoA per mL of culture supernatant sample as used in (A) and (B). The measured data in activity units (Supporting Table S2) was normalized, whereby the values measured for the reference strain TS10 were set to 100%. Boxed numbers indicate the respective OD600 of the expressing strain post fermentation. (E) Luciferase activity assay on cellular and culture supernatant samples from the GLuc-producing strain IIG-Bs27-39 before and after treatment with DTT. The measured data in relative light units (Supporting Table S2) was normalized, wherein the value measured for the native culture supernatant was set to 100%.

