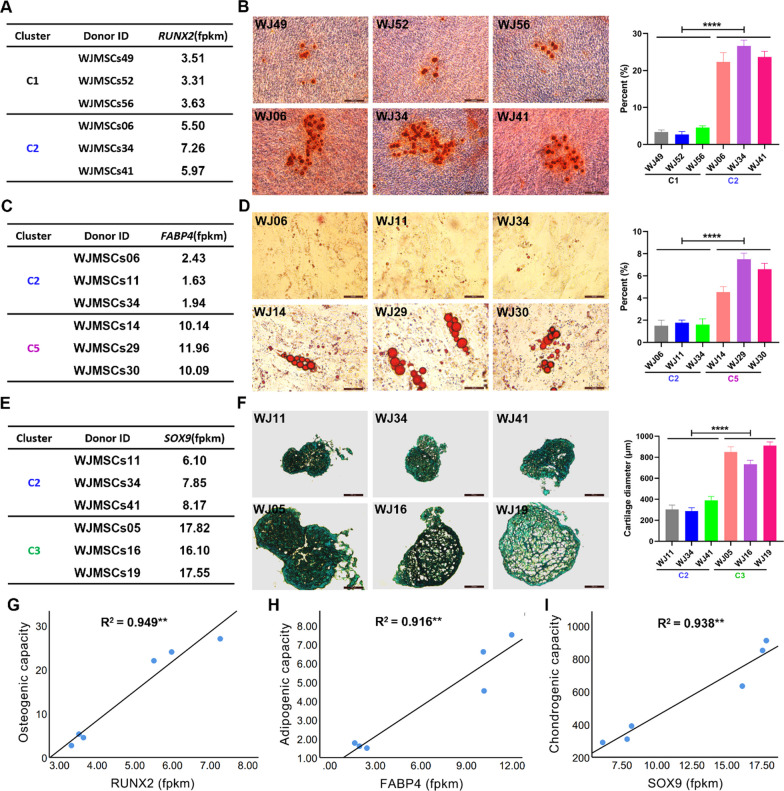
Fig. 2.
Differences of different donor-derived WJ-MSCs in tri-lineage differentiation bias. A, B The expression differences of RUNX2 (fpkm) (A) and representative alizarin red staining images of differentiated osteocytes (B) in 6 representative WJ-MSCs from the Cluster 1 and 2. The p value indicates the significant differences between C1 and C2 groups. C, D The expression differences of FABP4 (fpkm) (C) and representative oil red O staining images of differentiated adipocytes (D) in 6 representative WJ-MSCs from the Cluster 2 and 5. The p value indicates the significant differences between C2 and C5 groups. E, F The expression differences of SOX9 (fpkm) (E) and representative alcian blue staining images of differentiated chondrocytes (F) in 6 representative WJ-MSCs from the Cluster 2 and 3. The p value indicates the significant differences between C2 and C3 groups. G–I The correlations between the expression of RUNX2 in WJ-MSCs and the osteogenic differentiation bias (G), the expression of FABP4 in WJ-MSCs and the adipocyte differentiation bias (H), and the expression of SOX9 in WJ-MSCs and the chondrocyte differentiation bias (I). B, D, F, n = 3 each group. t tests were performed. Statistical significance is indicated by *P < 0.05, **P < 0.01, ***P < 0.001, ****P < 0.0001

