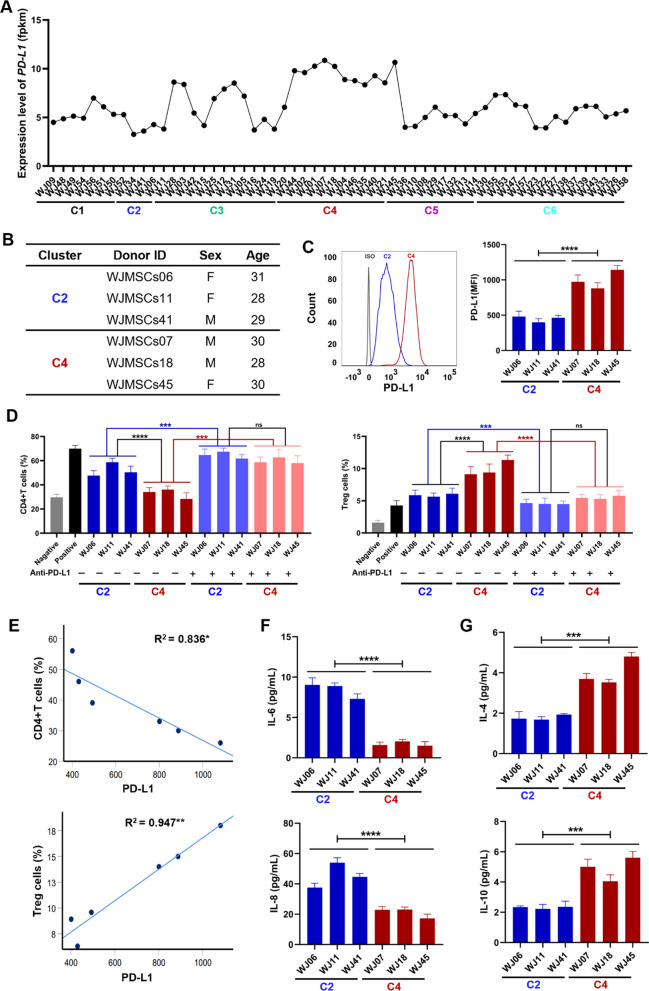
Fig. 3.
PD-L1high WJ-MSCs have stronger immunomodulatory capacity than PD-L1low WJ-MSCs. A Transcriptome analysis of the expression levels of PD-L1 from 58 WJ-MSCs. B Sample information of 6 representative WJ-MSCs from the Cluster 2 and C4. PD-L1 lowly expressed in WJ-MSCs06, WJ-MSCs11 and WJ-MSCs41, but highly expressed in WJ-MSCs07, WJ-MSCs18 and WJ-MSCs45. C Quantification of PD-L1(MFI) expression levels in 6 different WJ-MSCs by flow cytometry. The gray line is isotype control, the blue line is Cluster 2, and the red line is Cluster 4. D The effects of PD-L1 neutralizing antibody on WJ-MSCs in inhibiting the proportion of CD4+T cells and increasing the production of Treg subpopulation in PBMCs. n = 3 in each group. E The correlation analysis between the expression of PD-L1 in WJ-MSCs and the proportions of CD4+T cells (F) or Treg cells (G). F-G. Quantification of pro-inflammatory cytokines (F) and anti-inflammatory cytokines (G) in the secretomes of WJ-MSCs by ELISA assays. n = 3 in each group. t tests were performed. The p value indicates the significant differences between C2 and C4 groups. Statistical significance is indicated by *P < 0.05, **P < 0.01, ***P < 0.001, ****P < 0.0001

