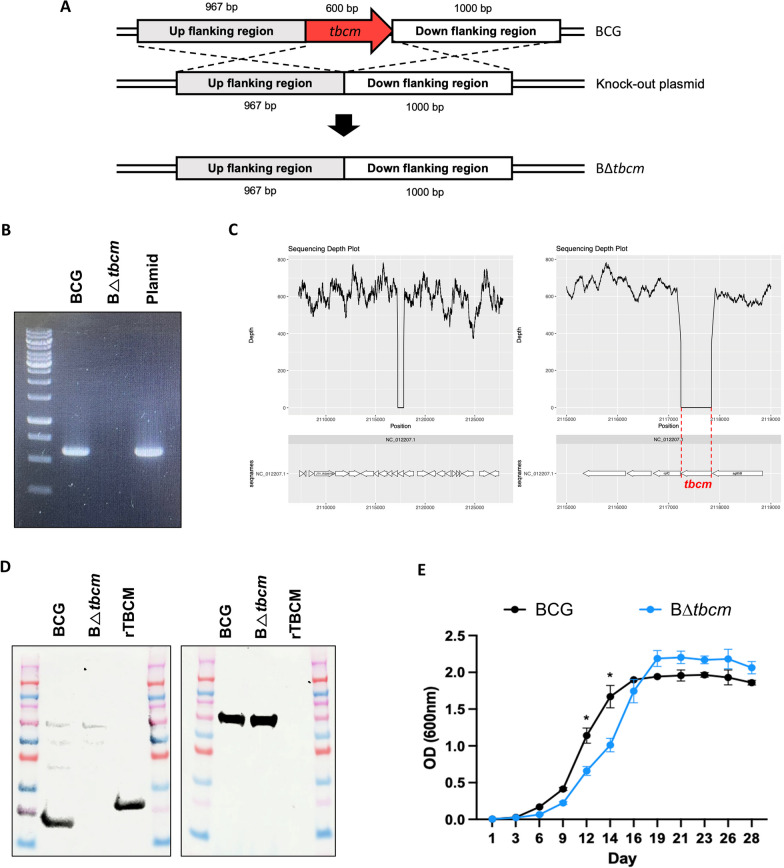
Fig. 1.
Generation of the Mycobacterium bovis BCG tbcm deletion mutant. A Schematic diagram of the tbcm gene deletion strategy. B Whole-gel image of polymerase chain reaction (PCR) confirmation of tbcm gene (600 bp) expression in wild-type BCG (BCG) and BΔtbcm. C Whole-genome sequencing result of gDNA isolated from BΔtbcm. The tbcm gene deletion was confirmed by a depth level of 0 in the sequencing depth plot. D Uncropped blot image of TBCM (left) and hsp65 (right) protein expression in BCG and BΔtbcm. rTBCM represents recombinant TBCM. E Graphs comparing the growth curves of BCG (gray) and BΔtbcm (blue). The growth curve of each mycobacterial strain was drawn by measuring the OD600 at each time point. All data were collected in at least three independent experiments and are presented as the mean ± SEM. The results were analyzed for statistical significance by two-way ANOVA with Tukey’s multiple comparison test. (*P < 0.05, **P < 0.01, ***P < 0.001). BCG wild-type BCG, BΔtbcm, BCG Δtbcm mutant

