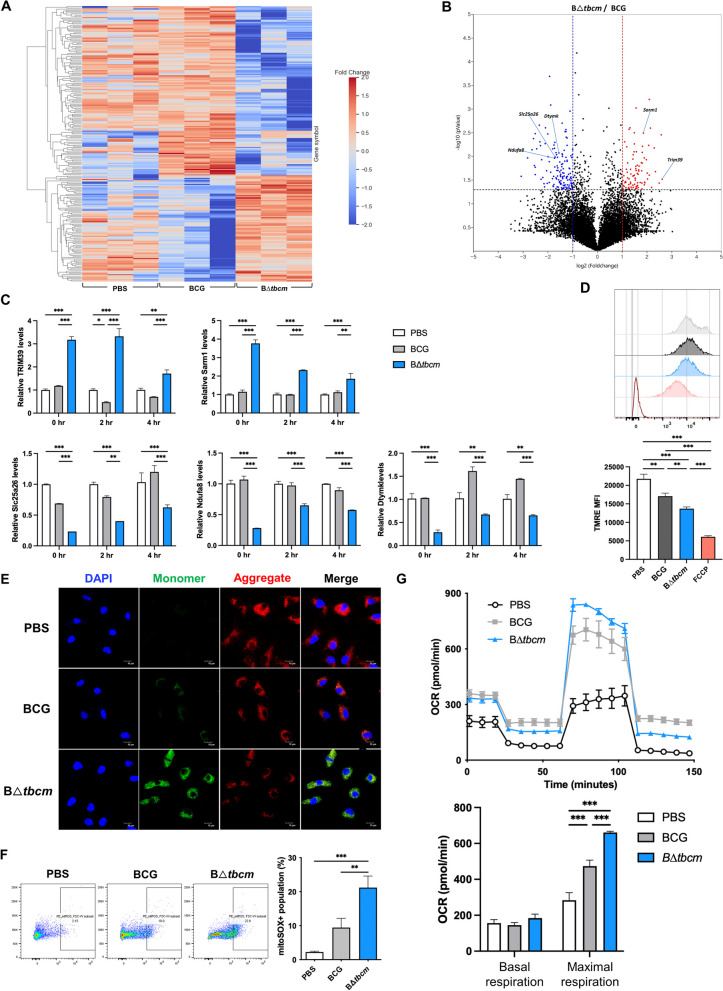
Fig. 4.
BΔtbcm induces mitochondrial dysfunction in macrophages. BMDMs (BALB/c, female) were infected with BCG or BΔtbcm at an MOI of 10. A, B DEGs between BCG- and BΔtbcm-infected BMDMs at 2 h postinfection. A Heatmap presenting the DEGs in BCG- or B∆tbcm-infected BMDMs and (B) a volcano plot (blue and red dots show DEGs with decreased and increased expression, respectively). C The upregulated (TRIM39, SARM1) and downregulated (SLC25A26, NDUFA8, DTYMK) gene expression levels were measured by real-time PCR at 0, 2 and 4 h postinfection. D The mitochondrial membrane potential (ΔΨm) was measured by TMRE staining and analyzed by flow cytometry at 24 h postinfection. E Fluorescence microscopy images representing ΔΨm at 24 h post infection by JC-1 staining. F mtROS levels were measured by mitoSOX staining at 2 h postinfection. G Respiratory profiles (oxygen consumption rate) of infected BMDMs were analyzed by an Agilent Seahorse XFe24 analyzer 2 h postinfection (left). Bar graphs showing quantification of basal respiration and maximal respiration derived from the respiratory profile (right). All data were collected in at least three independent experiments and are presented as the mean ± SEM. The results were analyzed for statistical significance by two-way (C) or one-way (D, F, G) ANOVA with Tukey’s multiple comparison test. (*P < 0.05, **P < 0.01, ***P < 0.001). BCG wild-type BCG, BΔtbcm, BCG Δtbcm mutant

