Fig. 1.
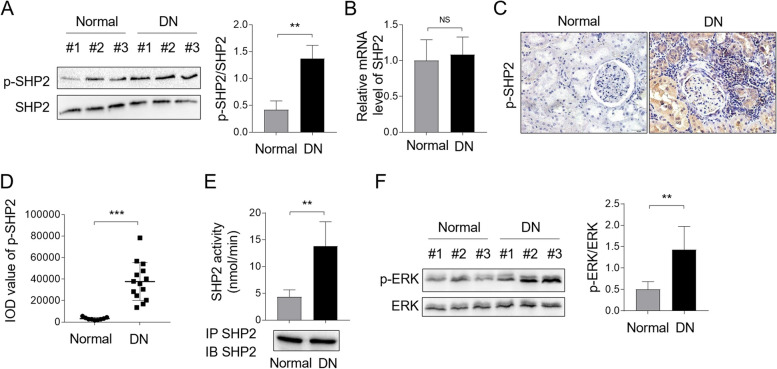
SHP2 is activated in DN patients. A levels of p-SHP2 and basal SHP2 protein expression in DN kidney biopsies were measured by Western blot analysis. Normal kidey biopsies were used as control samples. The intensity of potein bands was quntified by ImageJ and the ratio of p-SHP2/SHP2 was shown right. Student’s test, **, p < 0.01 (n = 6). B The mRNA level of SHP2 in DN and normal groups was checked by qRT-PCR analysis. The result relative to the normal group was depicted. Student’s test, NS, not significant (n = 6). C, D Immunostaining of p-SHP2 on normal kidney sections (n = 9) and kidney biopsy samples of DN patients (n = 14) was visualized by IHC experiment (C). The integrated optical density (IOD) of p-SHP2 expression in (C) was shown (D). One-way ANOVA test followed by a Holm-Sidak post-test, ***, p < 0.001. E SHP2 immune complex PTP assay was performed using pNPP as a substrate on human DN samples (n = 9) and normal controls (n = 6). Immunoblotting control for immunoprecipitated SHP2 was shown below. One-way ANOVA test followed by a Holm-Sidak post-test, **, p < 0.01. F Levels of p-ERK and basal ERK protein expression in DN kidney biopsies were measured by Western blot analysis. Normal kidey biopsies were used as control samples. The intensity of potein bands was quntified by ImageJ and the ratio of p-ERK/ERK was shown right. Student’s test, **, p < 0.01 (n = 6)

