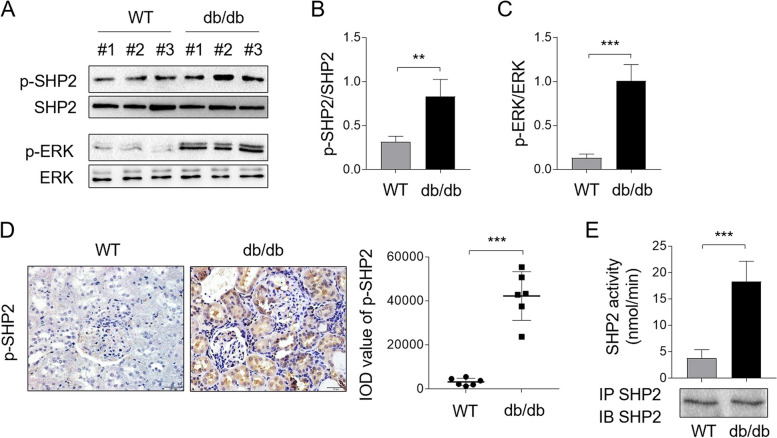
Fig. 2.
SHP2 is activated in db/db mice. A Levels of p-SHP2, p-ERK and their basal protein expression in kidney biopsies of db/db mice were measured by Western blot analysis. Normal kidey biopsies of WT mice were used as control samples. B, C The intensity of potein bands (A) was quntified by ImageJ and the ratio of p-SHP2/SHP2 (B) and p-ERK/ERK (C) was shown right. Student’s test, **, p < 0.01; ***, p < 0.001 (n = 6). D Immunostaining of p-SHP2 on mouse normal kidney sections (n = 6) and kidney biopsy samples of db/db mice (n = 6) was detected by IHC experiment. The integrated optical density (IOD) of p-SHP2 expression was shown right. Student’s test, ***, p < 0.001. E SHP2 immune complex PTP assay was performed using pNPP as a substrate on normal kidney samples (n = 6) from WT mice and DN kidney samples from db/db mice (n = 6). Immunoblotting control for immunoprecipitated SHP2 was shown below. Student’s test, ***, p < 0.001

