Figure 1.
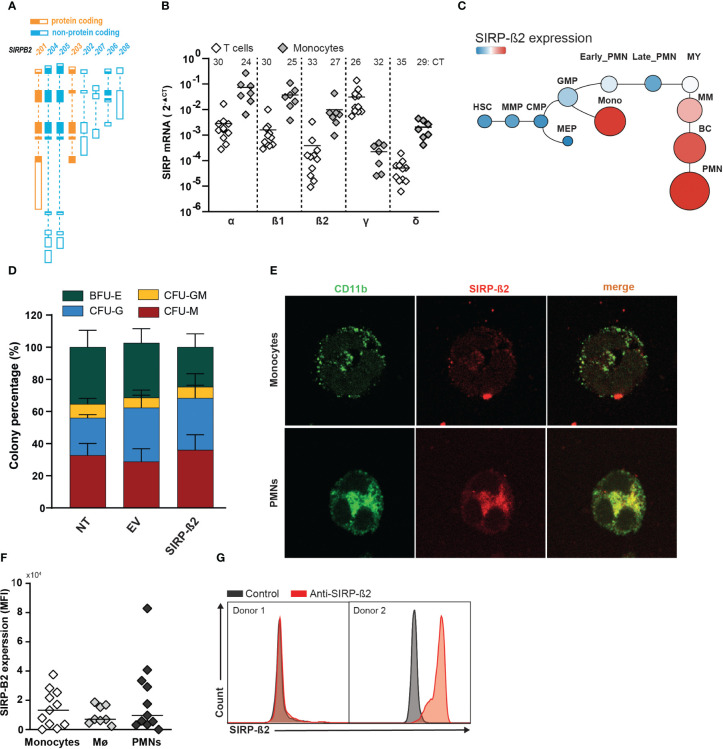
Expression pattern, genomic arrangement and transcript variants of the SIRP family. (A) Schematic representation of the protein coding and non-coding transcript variants of the SIRP-ß2 locus. (B) Quantitative RT-qPCR analysis of mRNA expression in T cells and monocytes of SIRP family transcripts. (C) mRNA SIRP-ß2 expression in hierarchical differentiation tree. (D) Colony percentage of BFU-E (Burst Forming Unit E), CFU-GM (Colony-Forming Unit for granulocytes and macrophages) after 14days. 1x10³ CD34+ cells derived from cord blood (CB) plated, transduced with NT, EV and SIRP-ß2. (E) Confocal images of the surface expression of CD11b and SIRP-ß2 on monocytes. (F) Flow cytometry of SIRP-ß2 levels on monocytes (n=11), monocyte-derived macrophages (n=8) and polymorphonuclear neutrophil (PMN) (n=11), including different donors. (G) SIRP-ß2 expression pattern on flow cytometry from 2 different donors.

