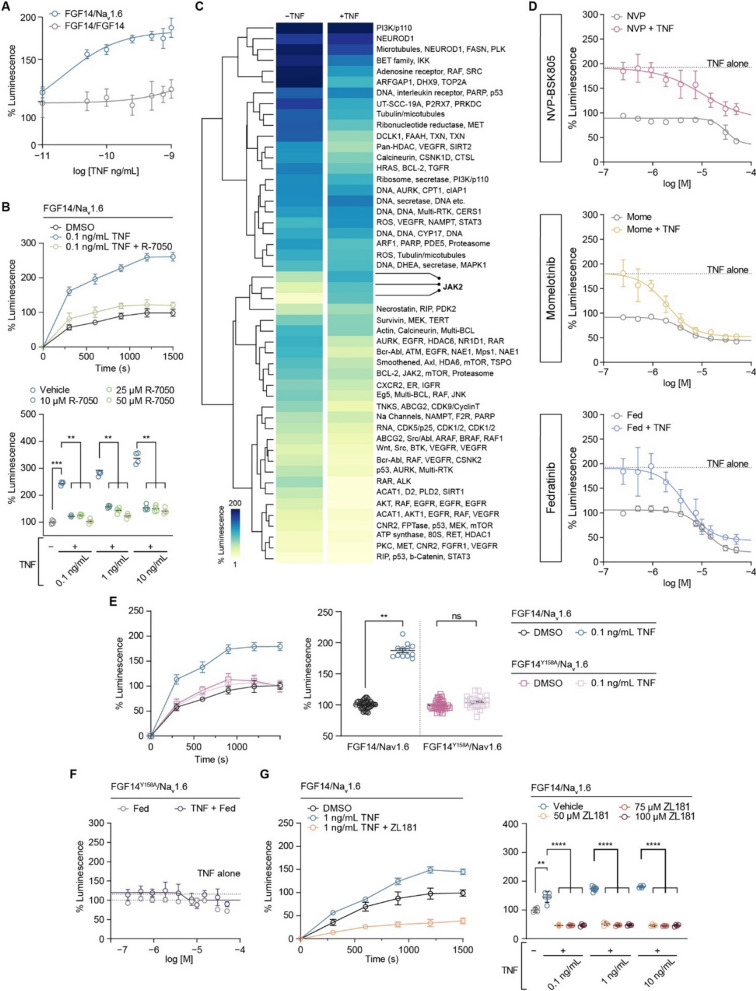
Fig. 1.
Increased assembly of the FGF14/Nav1.6 complex mediated by the TNFR1–JAK2 pathway. A Comparison of the effects of increasing concentrations of TNF on FGF14/Nav1.6 complex assembly (n = 10–12 biological replicates/group) and FGF14/FGF14 complex assembly (n = 20 biological replicates/group). B Top: percentage luminescence in the split-luciferase complementation assay (LCA) as a function of time for the indicated experimental groups. Bottom: comparison of the effects of TNF on FGF14:Nav1.6 complex assembly in the presence of increasing concentrations of TNF and the TNFR1 antagonist R-7050 (n = 4 biological replicates/group). C Heatmap summary of high-throughput screening of kinase inhibitors against FGF14/Nav1.6 complex assembly. D Dose–response analyses of three structurally diverse JAK2 inhibitors against FGF14/Nav1.6 complex assembly with and without TNF pre-treatment (n = 4–5 biological replicates/group). E Left: percentage luminescence in the LCA as a function of time for the indicated experimental groups. Right: effects of 1 ng/mL TNF treatment on FGF14/Nav1.6 and FGF14Y158A/Nav1.6 complex assembly (n = 12–38 biological replicates/group). F Dose–response analyses of the JAK2 inhibitor fedratinib on FGF14.Y158A/Nav1.6 complex assembly with and without TNF stimulation (n = 4–5 biological replicates/group). G Left: percentage luminescence in the LCA as a function of time for the indicated experimental groups. Right: effects of ZL181 treatment on the TNF-induced increase in FGF14:Nav1.6 complex assembly (n = 4–8 biological replicates/group). Data are represented as mean ± SEM. In (B, bottom and G, right) significance was assessed using a 2-way ANOVA with post hoc Dunnett’s multiple comparisons test. In (E, right), significance was assessed using a Student’s t-test (ns not significant; **p < 0.01; ***p < 0.001; ****p < 0.0001)

