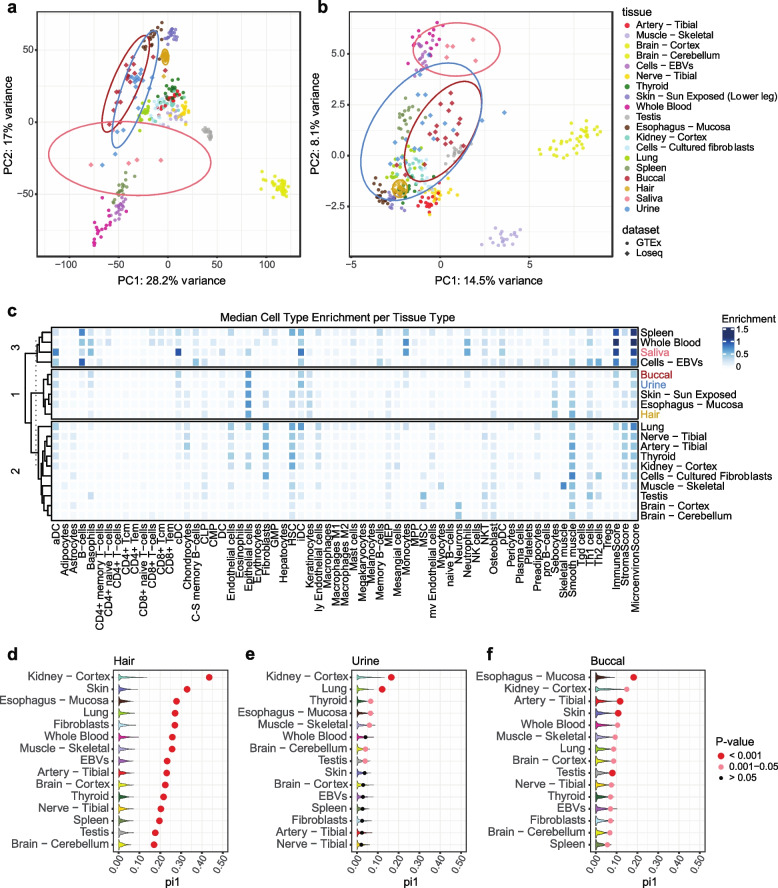
Fig. 4.
Comparison of noninvasive samples to the GTEx dataset. a Noninvasive sample types projected onto the GTEx expression PCA space. Counts were normalized using DESeq2, centered and scaled, and the top 1000 most variable genes were used. Ellipses represent 95% confidence intervals. b Noninvasive sample types projected onto the top 1000 most variable rMATS splicing events in GTEx. c xCell cell type enrichment estimates per tissue. Tissues are clustered using k-means clustering. d, e, f GTEx eQTL replication estimates for hair, urine, and buccal samples. Dots show π1 calculated by selecting significant GTEx gene-variant pairs from the noninvasive data with sizing indicating permutation p-value significance. Violin plots show null π1 distributions generated from allele-frequency matched, randomly selected gene-variant pairs. 1000 permutations were performed

