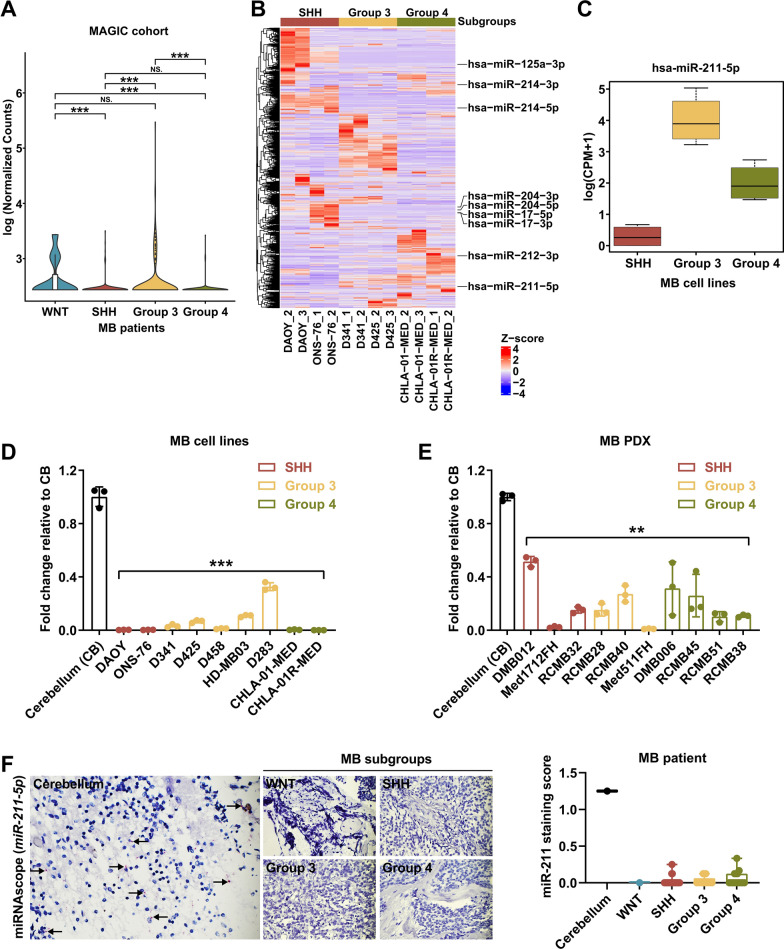
Fig. 1.
miR-211 expression is downregulated in MB. A Violin plot showing distribution of normalized expression of miR-211 in the 4 molecular subgroups (WNT: 11, SHH: 250, Group 3: 219, Group 4: 326) of MB patients from the MAGIC cohort (n = 806). B Heatmap of differential miRNA expression in six MB cell lines (SHH: DAOY and ONS-76, Group 3: D341 and D425, Group 4: CHLA-01-MED and CHLA-01R-MED). Gene expression data were obtained using human small RNA-seq. Expression values shown are z-scores. C Normalized expression of miR-211 in the MB cell lines from small RNA-seq. D, E Expression of miR-211 in SSH, Group 3, and Group 4 MB cell lines (D) and patient-derived xenograft (PDX) samples E was detected by qRT-PCR. Values indicate fold change relative to normal cerebellum (CB). F Representative images of CISH for miR-211-positive normal cerebellum tissue (left panel). Scatter plot showing miR-211 staining score in normal cerebellum and different MB subgroups (right panel). Magnification × 400. Arrowhead, miR-211-positive cells. Data, mean ± SD. **P < 0.01, ***P < 0.001

