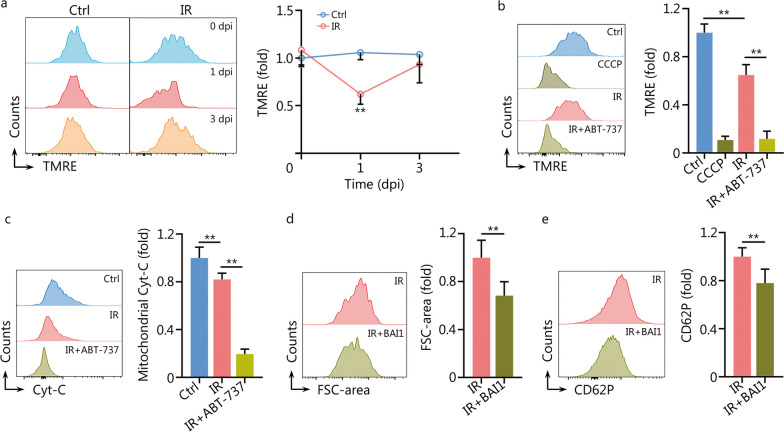
Fig. 4.
Minority MOMP is triggered in mMKs post IR. a Flow cytometric analysis and quantification of MMP in BM mMKs of mice at 1 and 3 dpi (n = 5). b Flow cytometric analysis and quantification of MMP in BM mMKs of mice with or without ABT-737 treatment at 1 dpi. CCCP-treated mMKs were used as the positive control for complete MOMP (n = 5). c Flow cytometric analysis and quantification of mitochondrial Cyt-C release in BM mMKs of mice with or without ABT-737 treatment at 1 dpi (n = 5). d Flow cytometric analysis and quantification of FSC-area of PLPs in Meg-01 cultures with or without BAI1 treatment at 3 dpi (n = 5). e Flow cytometric analysis and quantification of CD62P expression on PLPs from Meg-01 cultures with or without BAI1 treatment at 3 dpi (n = 5). Data represent mean ± standard deviation. **P < 0.01, compared to Ctrl or IR as indicated. Two-tailed unpaired student’s t-test. MOMP mitochondrial outer membrane permeabilization, mMK mature megakaryocyte, MMP mitochondrial membrane potential, CCCP carbonyl cyanide m-chlorophenylhydrazine, Cyt-C cytochrome C, BM bone marrow, FSC forward scatter, PLP platelet-like particle, Ctrl control, IR ionizing radiation, dpi day post IR, TMRE tetramethylrhodamine ethyl ester

