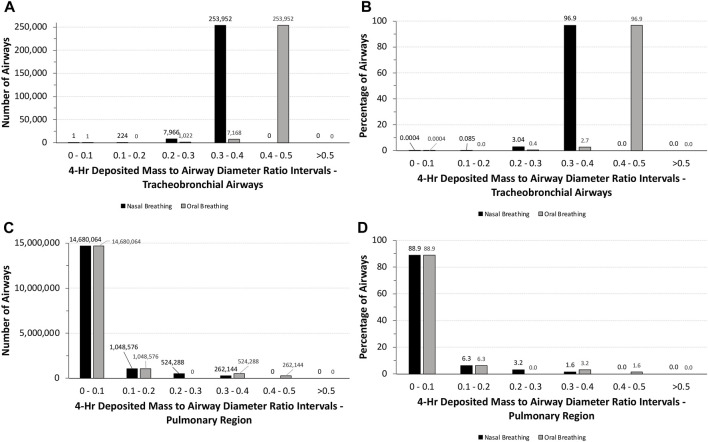
FIGURE 6.
Distributions of the total numbers and percentages of the ratios of theoretical diameters of deposited particle mass (volume) to their corresponding airway diameters in all (A,B) tracheobronchial and (C ,D) pulmonary airways of the symmetric Yeh and Schum model following a 4-h exposure to 5.212 mg/L aerosol for nasal and oral breathing. Ratios are grouped in intervals of 0–0.1, 0.1–0.2, 0.2–0.3, 0.3–0.4, 0.4–0.5, and >0.5.

