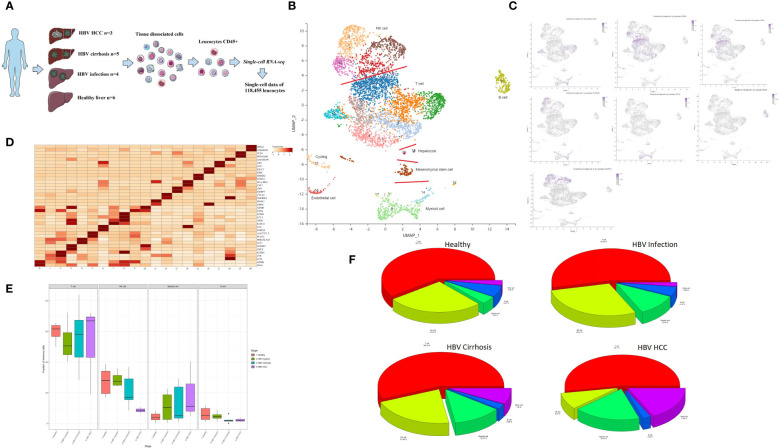
Figure 1.
Single-cell atlas of healthy, HBV-infected, HBV-cirrhotic, and HBV-HCC livers. (A) Workflow of isolation, sorting, and sc-RNASeq of CD45+ leukocytes from healthy liver to HBV infection, HBV cirrhosis, and HBV HCC using flow cytometry and 10× Genomics platform. (B) Clustering analysis of all the CD45+ leukocytes. (C) The expression of CD4, CD8A, CD8B, CD14, CD19, FCGR3A (CD16), and KLRF1 in UMAP plot. (D) The two most significant marker genes in each cluster displayed in the dot plot. (E) The proportion of T cells, NK cells, myeloid cells, and B cells from healthy liver to HBV infection, HBV cirrhosis, and HBV HCC. (F) Pie chart of the average proportion of T cells, NK cells, myeloid cells, and B cells from healthy liver to HBV infection, HBV cirrhosis, and HBV HCC.

