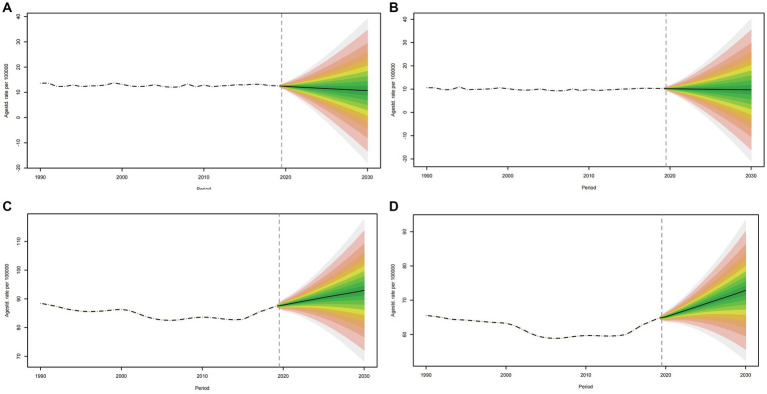
Figure 10.
Projections of ASIR (A, B) and ASYR (C, D) in males and females from 2020 to 2030. The open dot represents the observed value, and the fan shape, the predicted distribution between the 2.5 and 97.5% quantiles. The average forecast is shown as a solid line. The vertical dotted line indicates where the prediction begins. ASIR, age-standardized incidence rate.

