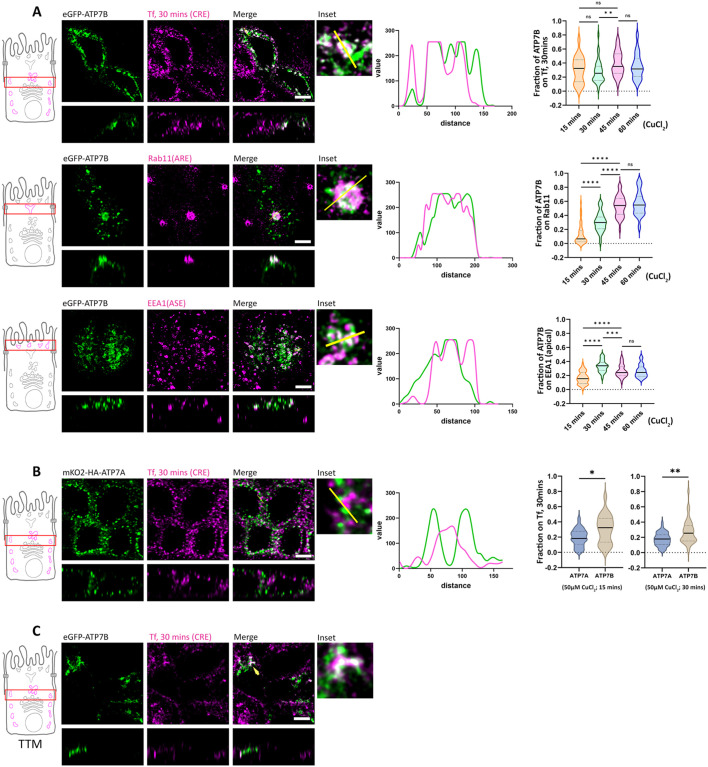
Fig. 3.
ATP7B traffics via different compartments whereas ATP7A does not traverse any intermediate compartment. (A) Polarized MDCK cells showing localization of transfected eGFP–ATP7B within various intermediate endosomes as it traffics in response to copper. Insets show zoomed images, and line profiles show pixel overlap on marked endosomes. Colocalization quantifications (Manders' colocalization coefficient) of transfected eGFP–ATP7B after a 30 min internalization Tf in all cases, with Rab11 and EEA1 at different time points of copper treatment (50 µM CuCl2) are shown on the right (N>30 for each condition). ATP7B traffics via CREs (30 min Tf–633 internalization), AREs (Rab11-positive compartments) and ASEs (EEA1-positive compartments). (B) Polarized MDCK cells showing localization of transfected mKO2–HA–ATP7A with CREs and BSEs (30 min Tf internalization) as it traffics in response to copper. ATP7A has very low overlap with CREs and BSEs (30 min Tf internalization). Colocalization quantification (Manders' colocalization coefficient) of transfected mKO2–HA–ATP7A versus eGFP–ATP7B with internalized Tf (30 min) at 15 min and 30 min copper treatment [Sample size (N) for (i) 15 min CuCl2 treatment; ATP7A: 60, ATP7B: 22, and (ii) 30 min CuCl2 treatment; ATP7A: 50, ATP7B: 34]. Cells were treated with 50 µM CuCl2 for 30 min for A and B. (C) Confocal image of polarized MDCK cells showing presence of eGFP–ATP7B (green) in CREs (magenta; 30 min Tf internalization) under TTM-treated conditions, indicating copper-independent trafficking of ATP7B (indicated by arrowhead). Violin plots show the median and quartiles, with a dotted line at 0. *P<0.05, **P<0.01, ***P<0.001, ****P<0.0001, ns; not significant (Mann–Whitney U-test/Wilcoxon rank-sum test). Scale bars: 5 µm.

