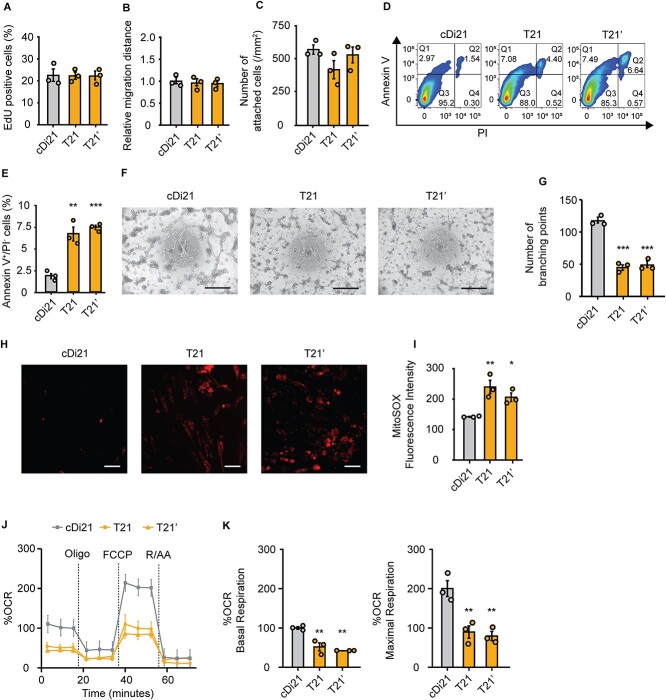
Figure 1.
Cellular physiology and mitochondrial respiratory function of T21-ECs and cDi21-ECs. (A) Proliferation assay evaluating the percentages of EdU-positive cells. There is no significant difference among cDi21-, T21-, and T21’-ECs. (B) Relative migration distance 12 h after the wound scratch of the cells. There is no significant difference among cDi21-, T21-, and T21’-ECs. (C) Cell adhesion assay by counting the number of attached cells 2 h after seeding. There is no significant difference among cDi21-, T21-, and T21’-ECs. (D) Representative images of apoptosis assay by flow cytometry for annexin V and propidium iodide (PI). (E) The quantitative analyses of annexin V-positive and PI-negative cell populations show that apoptotic cells are significantly increased in T21- and T21’-ECs as compared with cDi21-ECs. (F) Representative images of phase contrast microscopy in tube formation assay. Note that lots of cellular tubes are formed in cDi21-ECs. Scale bar: 500 μm. (G) The quantitative assessments tube formation show that ability of angiogenesis is impaired in T21- and T21’-ECs as compared with cDi21-ECs. (H) Representative fluorescent images of MitoSOX red staining for mitochondrial superoxide production assay. Scale bar: 50 μm. (I) The quantitative measurements of MitoSOX fluorescence intensity show that mitochondrial superoxide production is significantly increased in T21- and T21’-ECs. (J) Oxygen consumption rate (OCR) at baseline and after sequential injection of oligomycin, carbonyl cyanide 4-(trifluoromethoxy) phenylhydrazone (FCCP), and Rotenone/Antimycin A (R/AA). (K) Basal respiration and maximal respiration are significantly impaired in T21- and T21’-ECs. Three independent experiments were conducted each in A, B, C, E, G, and I. Five independent experiments were conducted in J and K. Data are presented as mean ± SEM. Data were analyzed by the Tukey–Kramer multiple comparison test. ***P < 0.001, **P < 0.01, *P < 0.05 as compared to cDi21-ECs.

