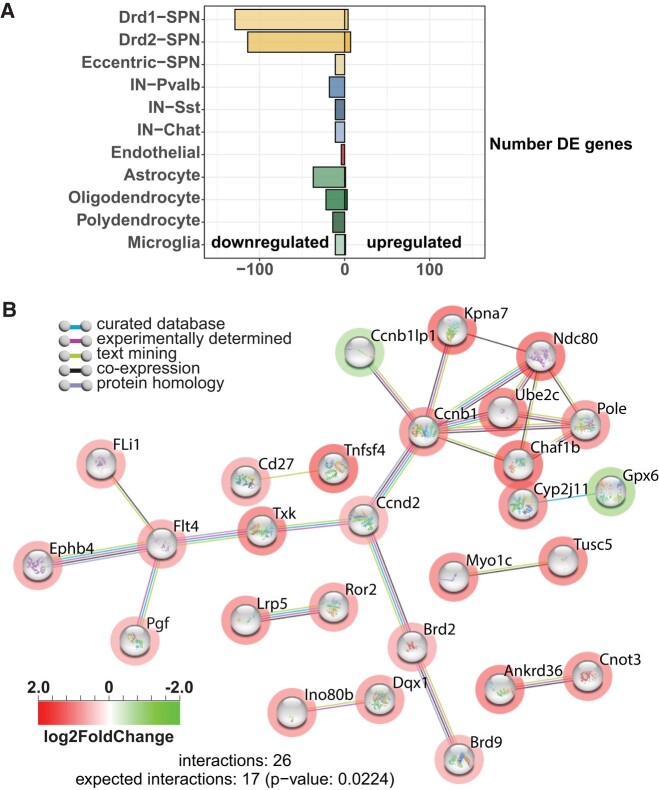
Figure 7.
Analysis of differentially expressed genes. (A) Number of genes upregulated [right; log2FC ≥ 1; false-discovery rate (FDR) ≤ 0.05] and downregulated (left; log2FC ≤ 1; FDR ≤ 0.05) in each cell type. (B) Interaction network for proteins (STRING) represented by genes differentially expressed after HTT inactivation in dSPN. Red circles indicate downregulated genes and green circles indicate upregulated genes. rRNA, ribosomal RNA; srpRNA, signal recognition particle RNA; tRNA, transfer RNA.

