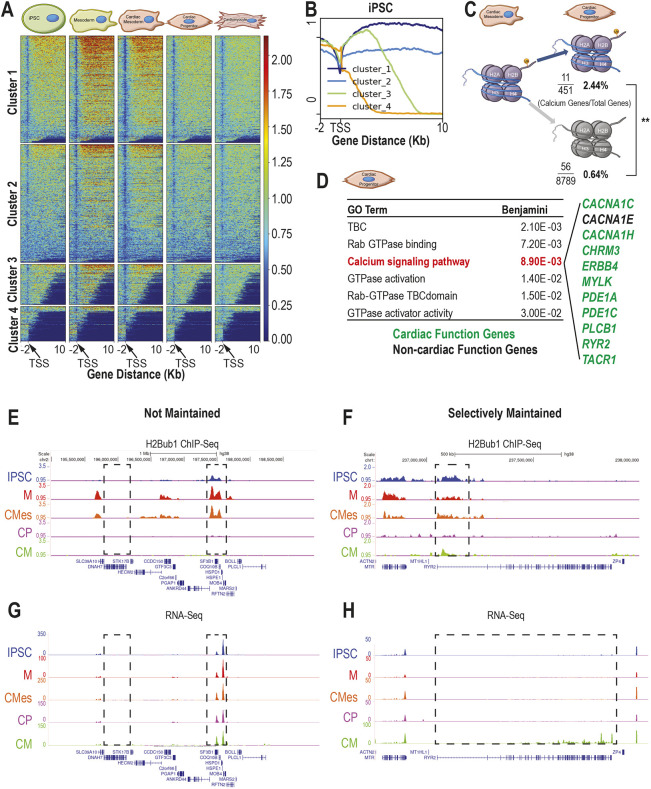
Fig. 3.
H2Bub1 in iPSC-derived cardiomyocyte development shows selective maintenance of calcium-signaling genes. (A) H2Bub1 surrounding the transcriptional start site (TSS) (−2 kb, +10 kb) genome-wide in five stages of CM differentiation [iPSC, mesoderm (M), cardiac mesoderm (CMes), cardiac progenitor (CP) and cardiomyocyte (CM) stages]. Genes are grouped by H2Bub1 occupancy into four clusters. The profile representing the average of three replicates, depicted using fold enrichment against random distribution values, across this region for each cluster in each stage is shown as a heatmap. (B) The cluster breakdown for iPSCs in A. Cluster 1 indicates high H2Bub1 levels, cluster 2 indicates low H2Bub1 levels, cluster 3 indicates moderate H2Bub1 levels and cluster 4 indicates no H2Bub1. (C) Proportion of genes that maintain H2Bub1 from CMes to CP stages that are calcium-signaling genes and the proportion of genes that have decreased H2Bub1 that are calcium-signaling genes. One-tailed, Z-score (**P<0.01). (D) The significant gene ontology terms from the genes near regions that maintain H2Bub1 between cardiac mesoderm (CMes) and cardiac progenitor (CP) stages. Genes associated with calcium-signaling pathways are listed and are in green if they are associated with cardiac function from patient variants and/or mouse models; they are in black if they are not. (E,F) Representative H2Bub1 occupancy, depicted using fold enrichment against random distribution across non-selectively maintained genes (E) and a selectively maintained gene (F) at five stages in cardiomyocyte (CM) differentiation [iPSC (blue), mesoderm (M) (red), CMes (orange), CP (purple) and CM (green) stages]. Gene structure is indicated below the H2Bub1 traces for each gene. The first box (E) highlights a gene that has no H2Bub1 signal at any stage. The second box (E) highlights a gene that has dynamic H2Bub1 signal across the stages. The selectively maintained region is indicated in the box (F). (G,H) Representative RNA-seq traces depicted in TPM across non-selectively maintained genes (G) and a selectively maintained gene (H), corresponding to the genes shown in E and F. Coloring is the same as in E and F, and the same regions are boxed. Gene structure is indicated below the H2Bub1 traces for each gene.

