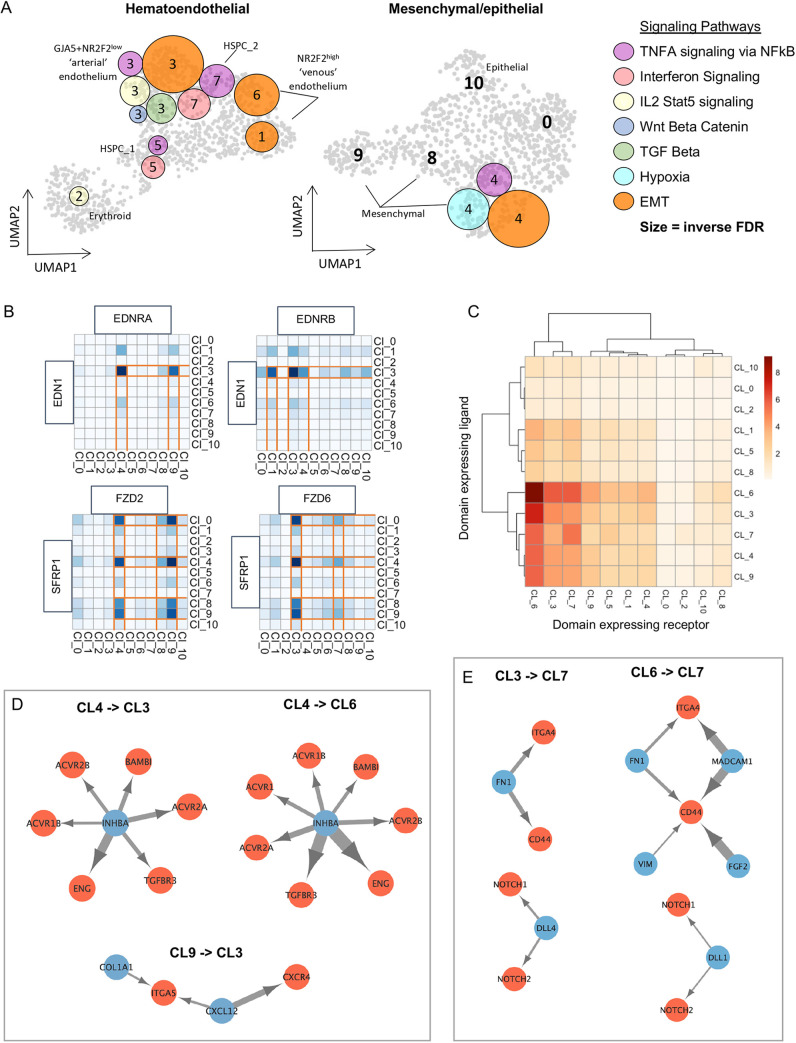
Fig. 6.
Resolved signalling networks across the Ao developmental niche. (A) Mapping of selected ventrally enriched signalling pathways to clusters on CS13-CS15 dorsal aortae UMAPs from Fig. 5A. Circle colour matches the pathway shown in the key. Circle size correlates with significance (size increases inverse to FDR). (B) Heatmap of predicted ligand-receptor signalling by expression and specificity edges for the indicated genes across all populations of the CS13-CS15 dorsal aorta UMAP. (C) Heatmap of the number of predicted ligand-receptor interactions between UMAP clusters (detection threshold 0.2). (D,E) Network map of selected top ligand (blue)-receptor (red) interactions between indicated clusters.

