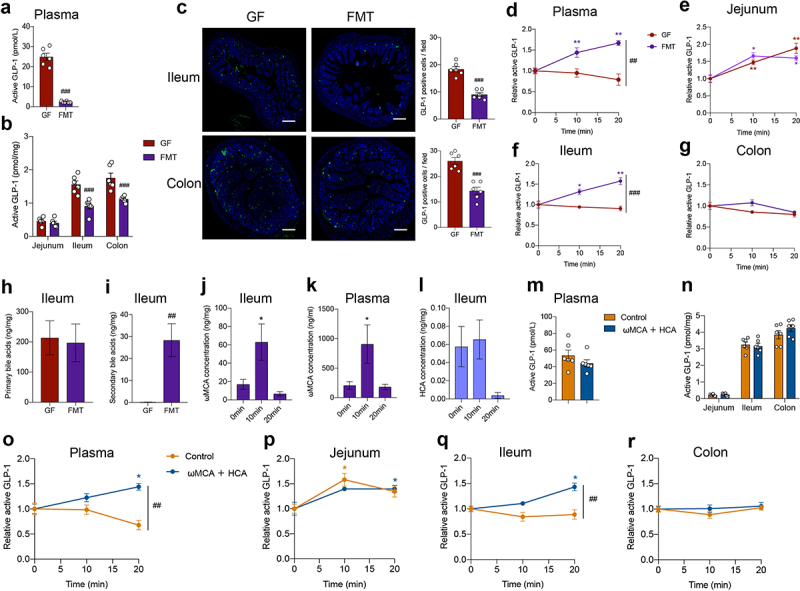
Figure 5.

FMT or bile acid treatment recovers postprandial GLP-1 response in microbiome- depleted mice. (a, b) Comparison of fasting GLP-1 levels in the plasma (a) and intestinal tissue (b) of GF mice and GF mice colonized with fecal microbiota (FMT) (n = 6 per group). (c) Representative immunofluorescence staining for GLP-1 (green) and quantification of GLP-1 positive cells in the ileum and colon from GF and FMT mice (n = 6 fields of 3 mice per group with each mice containing 2 fields). Nuclei were stained by DAPI (blue). Scale bars, 200 μm. (d-g) GLP-1 response after olive oil gavage in the plasma (d) and intestinal tissue (e-g) of GF and FMT mice (n = 6/time point/group). (h, i) Concentration of fasting primary bile acids (h) and secondary bile acids (i) in the ileum of GF and FMT mice (n = 6/group). (j, k) Changes in ωMCA after olive oil gavage in the ileum (j) and plasma (k) of FMT mice (n = 6 per time point). (l) Changes in HCA after olive oil gavage in the ileum of FMT mice (n = 6 per time point). (m, n) Comparison of fasting GLP-1 levels in the plasma (m) and intestinal tissue (n) of control or ωMCA + HCA treated ABX mice (n = 6 per group). (o-r) GLP-1 response after olive oil gavage in the plasma (o) and intestinal tissue (p-r) of control or ωMCA + HCA treated ABX mice (n = 6/time point/group). Data are shown as mean ± SEM. *P < .05, **P < .01, vs. 0 min; ##P < .01, ###P < .001, vs. GF mice or control group. Statistical significance was determined by (a-c, h and i, m and n) unpaired Student’s t-test, (d-g, o-r) two-way ANOVA with the Dunnett’s posttest, or (j-l) one-way ANOVA with the Dunnett’s posttest. Abbreviations: ωMCA: ω-muricholic acid; HCA: hyocholic acid.
