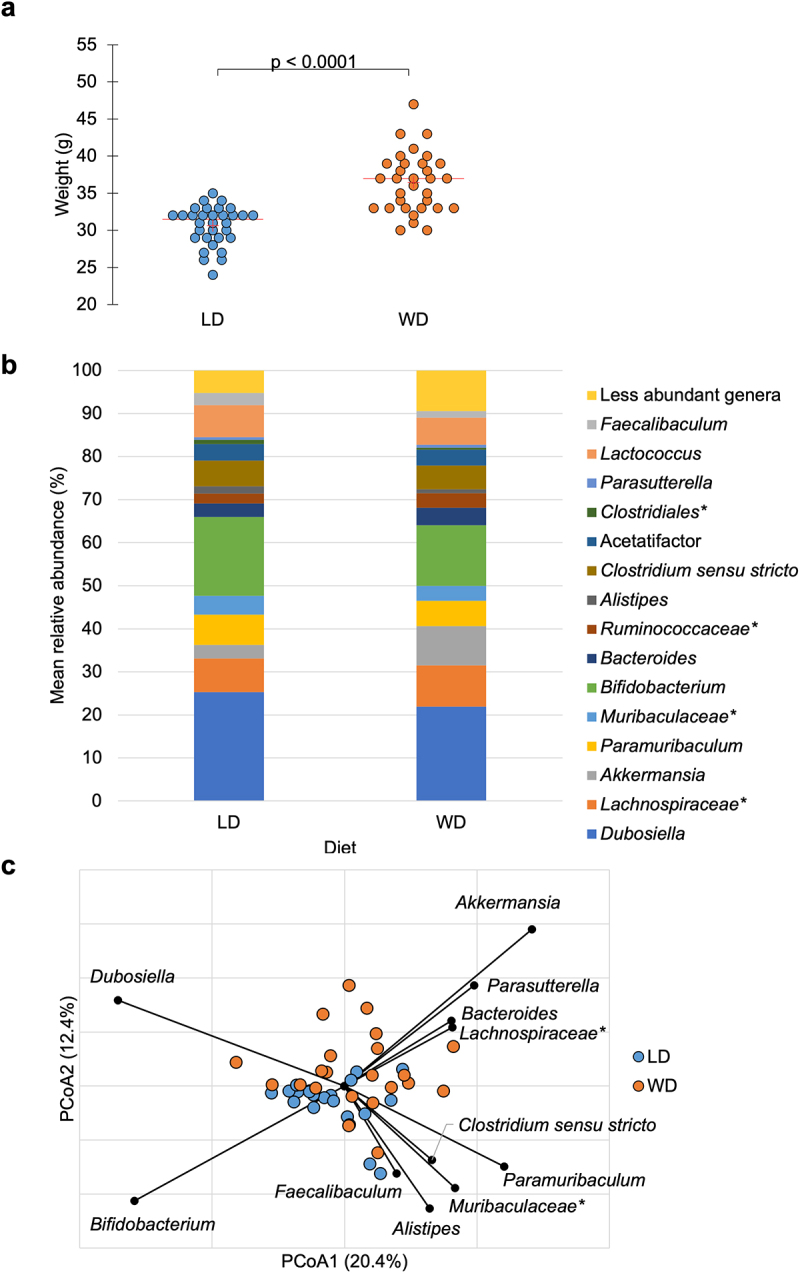
Figure 2.

a) Mean weight on DOS varied by dietary group: LD: 30.6 ± 2.6 g, WD: 36.4 ± 4.0 g (ANOVA F = 47.2, P <.0001). b) abundant taxa for each dietary groups after 10-week feeding period prior to DietGel initiation (baseline). c) Bray-Curtis dissimilarity indices demonstrated significant clustering by diet at baseline (ANOSIM R = 0.15, P <.001). Genera significantly correlated to dietary axis position by Spearman correlation are plotted on the PCoA chart with vector length indicating magnitude of correlation. *Not further classified to genus.
