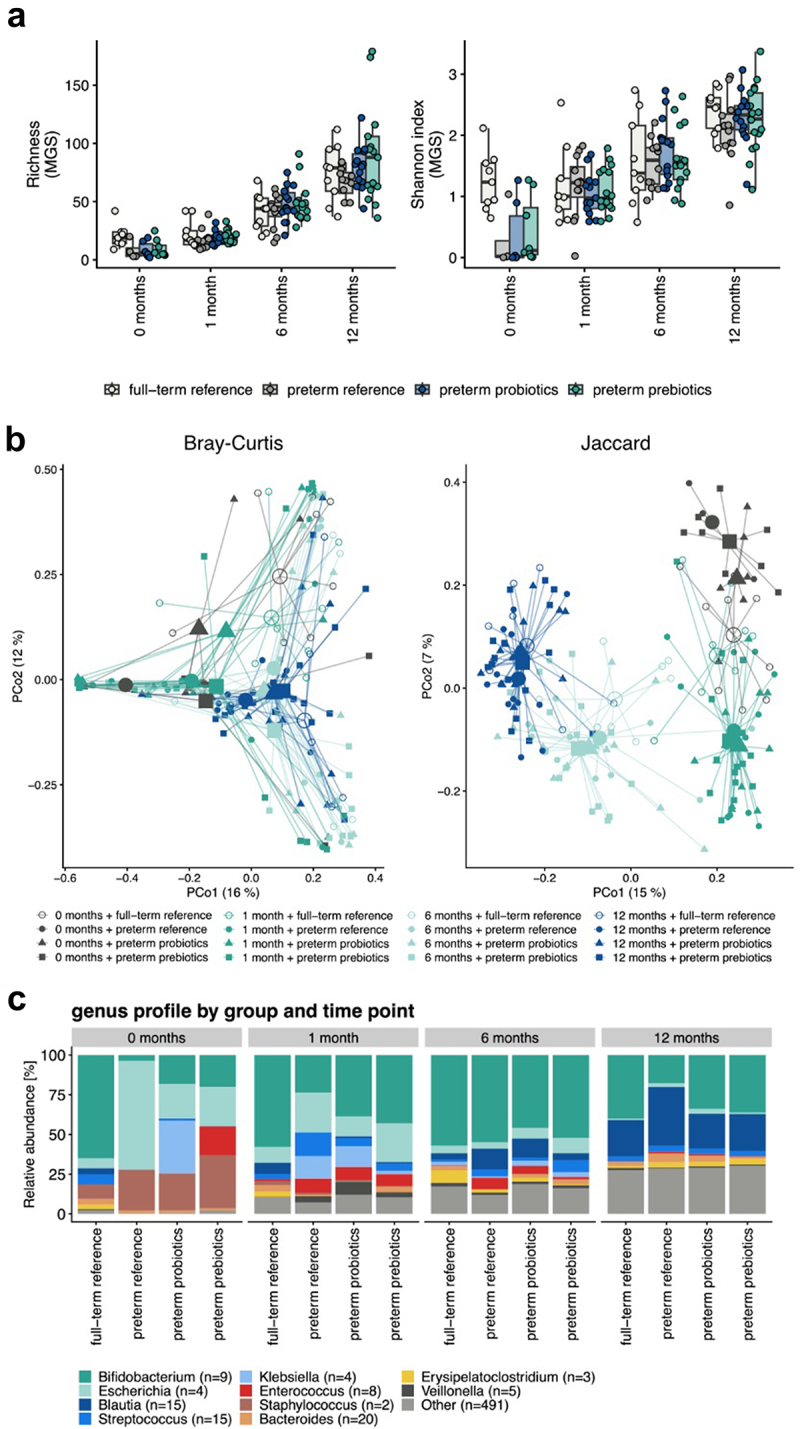
Figure 3.

a) alpha diversity differences for the three preterm intervention groups (probiotics, prebiotics, and reference (placebo)) and full-term reference group at the age of 1, 6, and 12 months represented as richness (MGS) and Shannon Index (MGS). No significant differences were observed. b) beta diversity differences for the three preterm intervention groups (probiotics, prebiotics, and reference (placebo)) and full-term reference group at the age of 1, 6, and 12 months. The calculations are based on the MGS abundances and represented as Bray–Curtis dissimilarities and a Jaccard Index. c) bar plot illustrating the taxonomic profiles aggregated separately at the genus levels for the three preterm intervention groups (probiotics, prebiotics, and reference (placebo)) and full-term reference group at the age of 1, 6, and 12 months.
