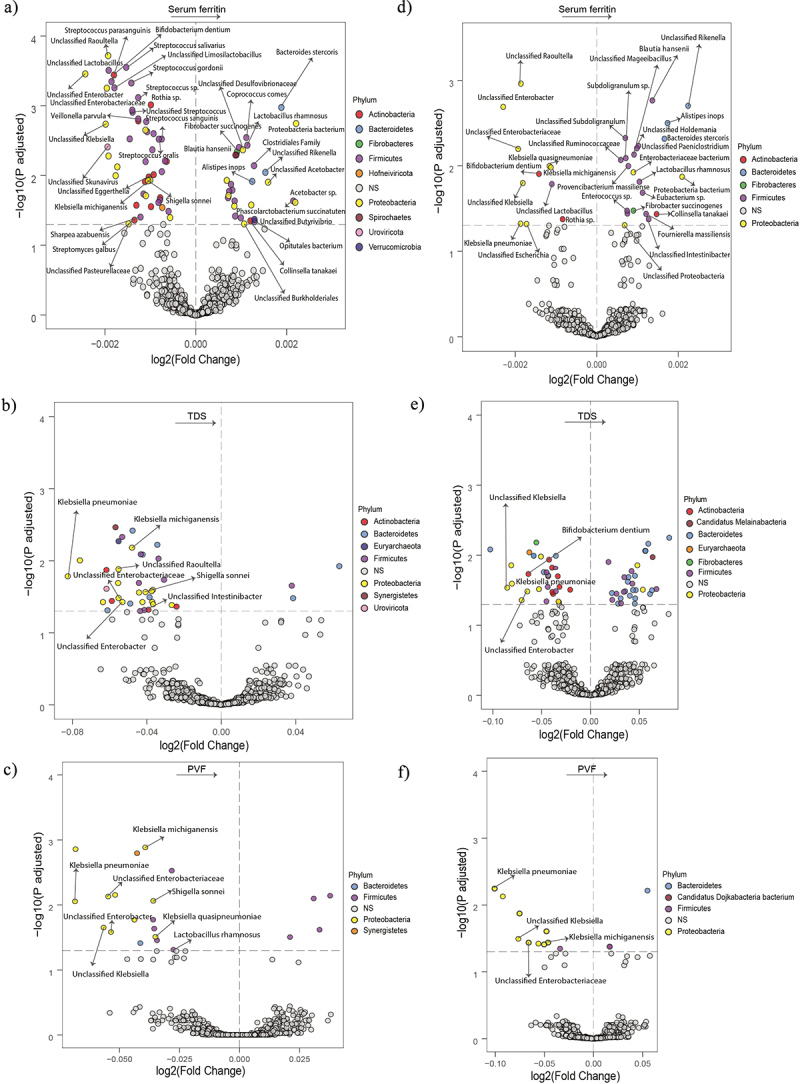
Figure 1.

Association of the gut microbiota composition with serum ferritin and executive function in the entire cohort and in men. (a-c) Volcano plots of the gut microbiota associated (p adjusted < 0.05) with serum ferritin (a), TDS (b), and PVF (c) in the entire cohort as calculated by ANCOM-BC from shotgun metagenomic sequencing, adjusting all three models for age, BMI, and sex; and for years of education in TDS, and PVF models. Only the microbial species associated with serum ferritin, TDS (b) and serum ferritin, and PVF (c) are shown. (d-f) Volcano plots of the gut microbiota associated (p adjusted < 0.05) with serum ferritin (d), TDS (e), and PVF (f) in men as calculated by ANCOM-BC from shotgun metagenomic sequencing, adjusting for age and BMI (serum ferritin, TDS, and PVF), and years of education (TDS, and PVF). Only the microbial species associated with serum ferritin and TDS (e) and SF and PVF (f) are shown. The log2 fold change of the association with a unit change in the ANCOM-BC-transformed variable values and the log10 p values adjusted for multiple comparisons using a sequential goodness of fit were plotted for each taxon. Significantly different taxa are colored according to phylum. TDS, total digit span; PVF, phonemic verbal fluency; BMI, body mass index.
