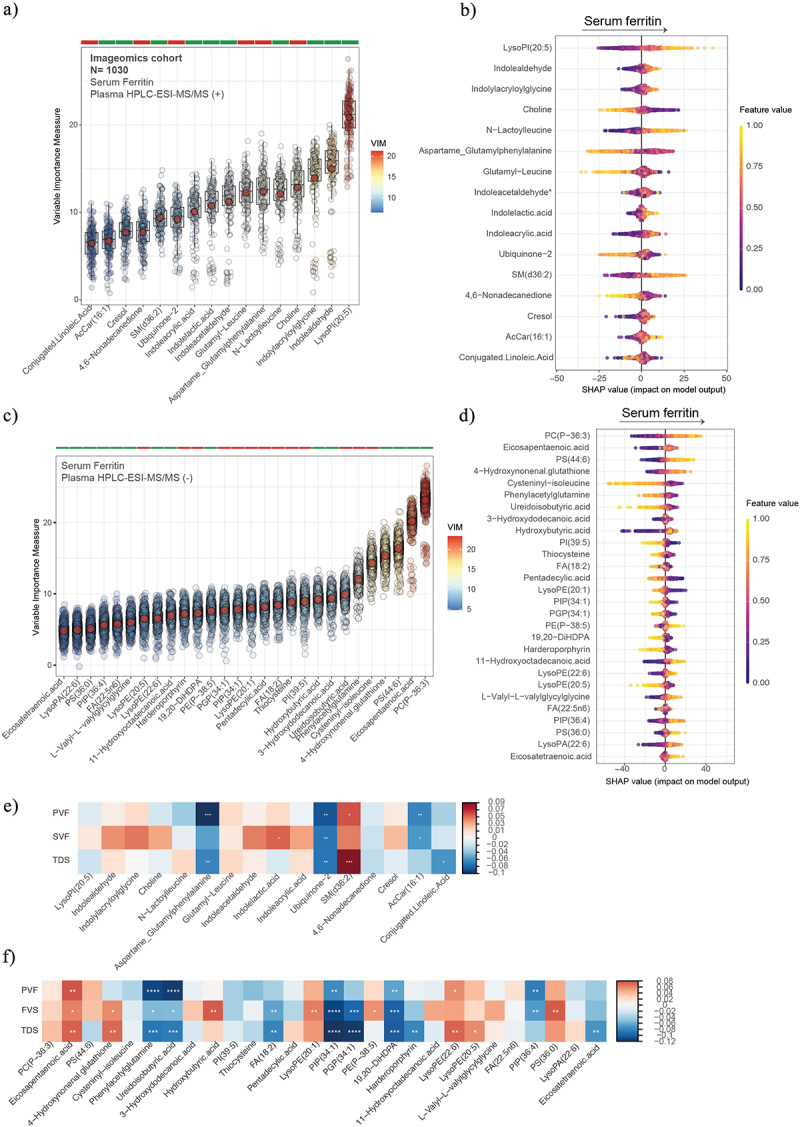
Figure 6.

Plasma metabolomics associated with serum ferritin, executive function, and semantic memory in the entire cohort. Boxplots of the normalized variable importance measure (VIM) (a and c) and SHAP summary plots (b and d), for the metabolites associated with the SF levels measured by HPCL-ESI-MS/MS in positive (a) and negative (c) models. (e and f) Heatmap displaying the Spearman correlation (adjusted by age, sex, body mass index, and education years) between PVF, SVF, and TDS and the plasma metabolomics in positive mode (e) and negative mode (f). Significant associations are shown with a cross: **** <0.001, ***<0.01, **<0.05, *<0.1.
