
Figure 2.
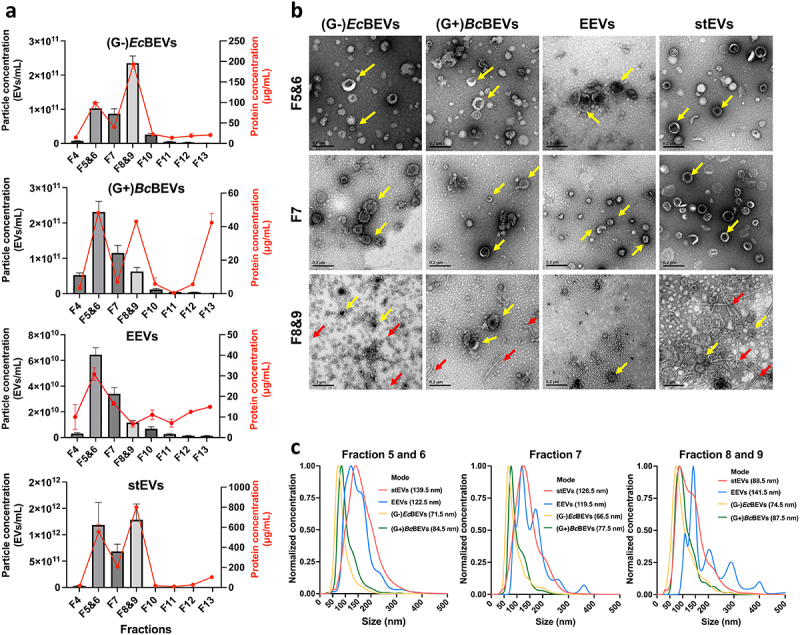
Characterization of EVs derived from four sources (G+ and G- bacterial medium, eukaryotic cell medium, and stool) by the same serial purification method (DG+UC). Samples were divided into several fractions by DG; fractions (F4-F13) were chosen for the characterization of EVs. F5 and F6, F8 and F9 were pooled, respectively. (a) Fractional distribution of particle concentration (left Y-axis, shown in a bar plot) and protein concentrations (right Y-axis, shown with a red line) from (G-)EcBEVs, (G+)BcBEVs, EEVs and stEVs. Results are shown as the means ± SDs of experiments performed in triplicate. (b) Representative TEM images of three major fractions (F5&6, F7 and F8&9) from four resources. (Scale bar = 0.2 µm) The yellow arrows indicate particles with a shape that conforms to the criteriaof EVs, and the red arrows indicate some linear structures, which may be fragments of bacterial flagella or pili. (c) Comparison of the particle sizedistribution, which has been normalized, (by converting the mode of each group to 1) of three main fractions from four different sources determined by NTA. Each line represents the average of two samples with three technical replicates.