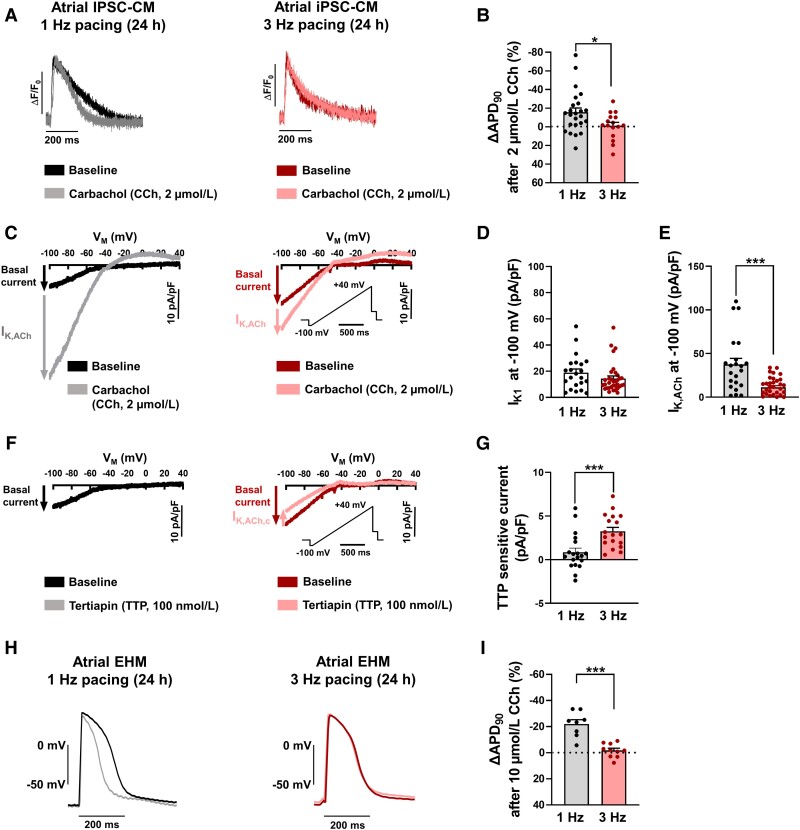
Figure 4.
Twenty-four hour TP-induced remodelling of inward-rectifier K+ currents in atrial induced pluripotent stem cell-derived cardiomyocytes (iPSC-aCM) and atrial engineered human myocardium (aEHM). (A), Representative optical action potentials (AP) elicited at 1 Hz in intact single iPSC-aCM after 24 h electrical pacing at 1 Hz (left) or 3 Hz (right) before (baseline) and after application of the M-receptor agonist carbachol (CCh, 2 µmol/L). (B), Percentage change of AP duration at 90% repolarization (APD90) following CCh application (1 Hz: 26/4, 3 Hz: n = 16/3). (C), Representative voltage-clamp recordings of inward-rectifier K+ current in single iPSC-aCM after 24 h electrical pacing at 1 Hz (left) or 3 Hz (right) before (baseline, IK1) and after CCh application, revealing the acetylcholine-activated inward-rectifier K+ current (IK,ACh). (D), Peak IK1 measured at −100 mV. E, Peak IK,ACh measured at −100 mV (D, E: 1 Hz: n = 22/2, 3 Hz: n = 34/2). (F), Representative voltage-clamp recordings of basal inward-rectifier K+ current in single iPSC-aCM after 24 h electrical pacing at 1 Hz (left) or 3 Hz (right) before (baseline) and after application of selective IK,ACh blocker tertiapin (TTP, 100 nmol/L). (G), Change in basal current at −100 mV following TTP application, defined as agonist independent constitutive IK,ACh (IK,ACh,c; 1 Hz: n = 19/2, 3 Hz n = 18/2). (H), Representative AP elicited at 1 Hz in aEHM after 24 h optical pacing at 1 Hz (left) or 3 Hz (right) before and after CCh application (10 µmol/L). (I), Percentage change of APD90 following CCh application (1 Hz: n = 8/5, 3 Hz: n = 10/5). Data are mean ± SEM. *P < 0.05, ***P < 0.001 vs. 1 Hz using paired Student’s t-test. n/N = number of iPSC-CM/differentiation or number of recordings/EHM.

