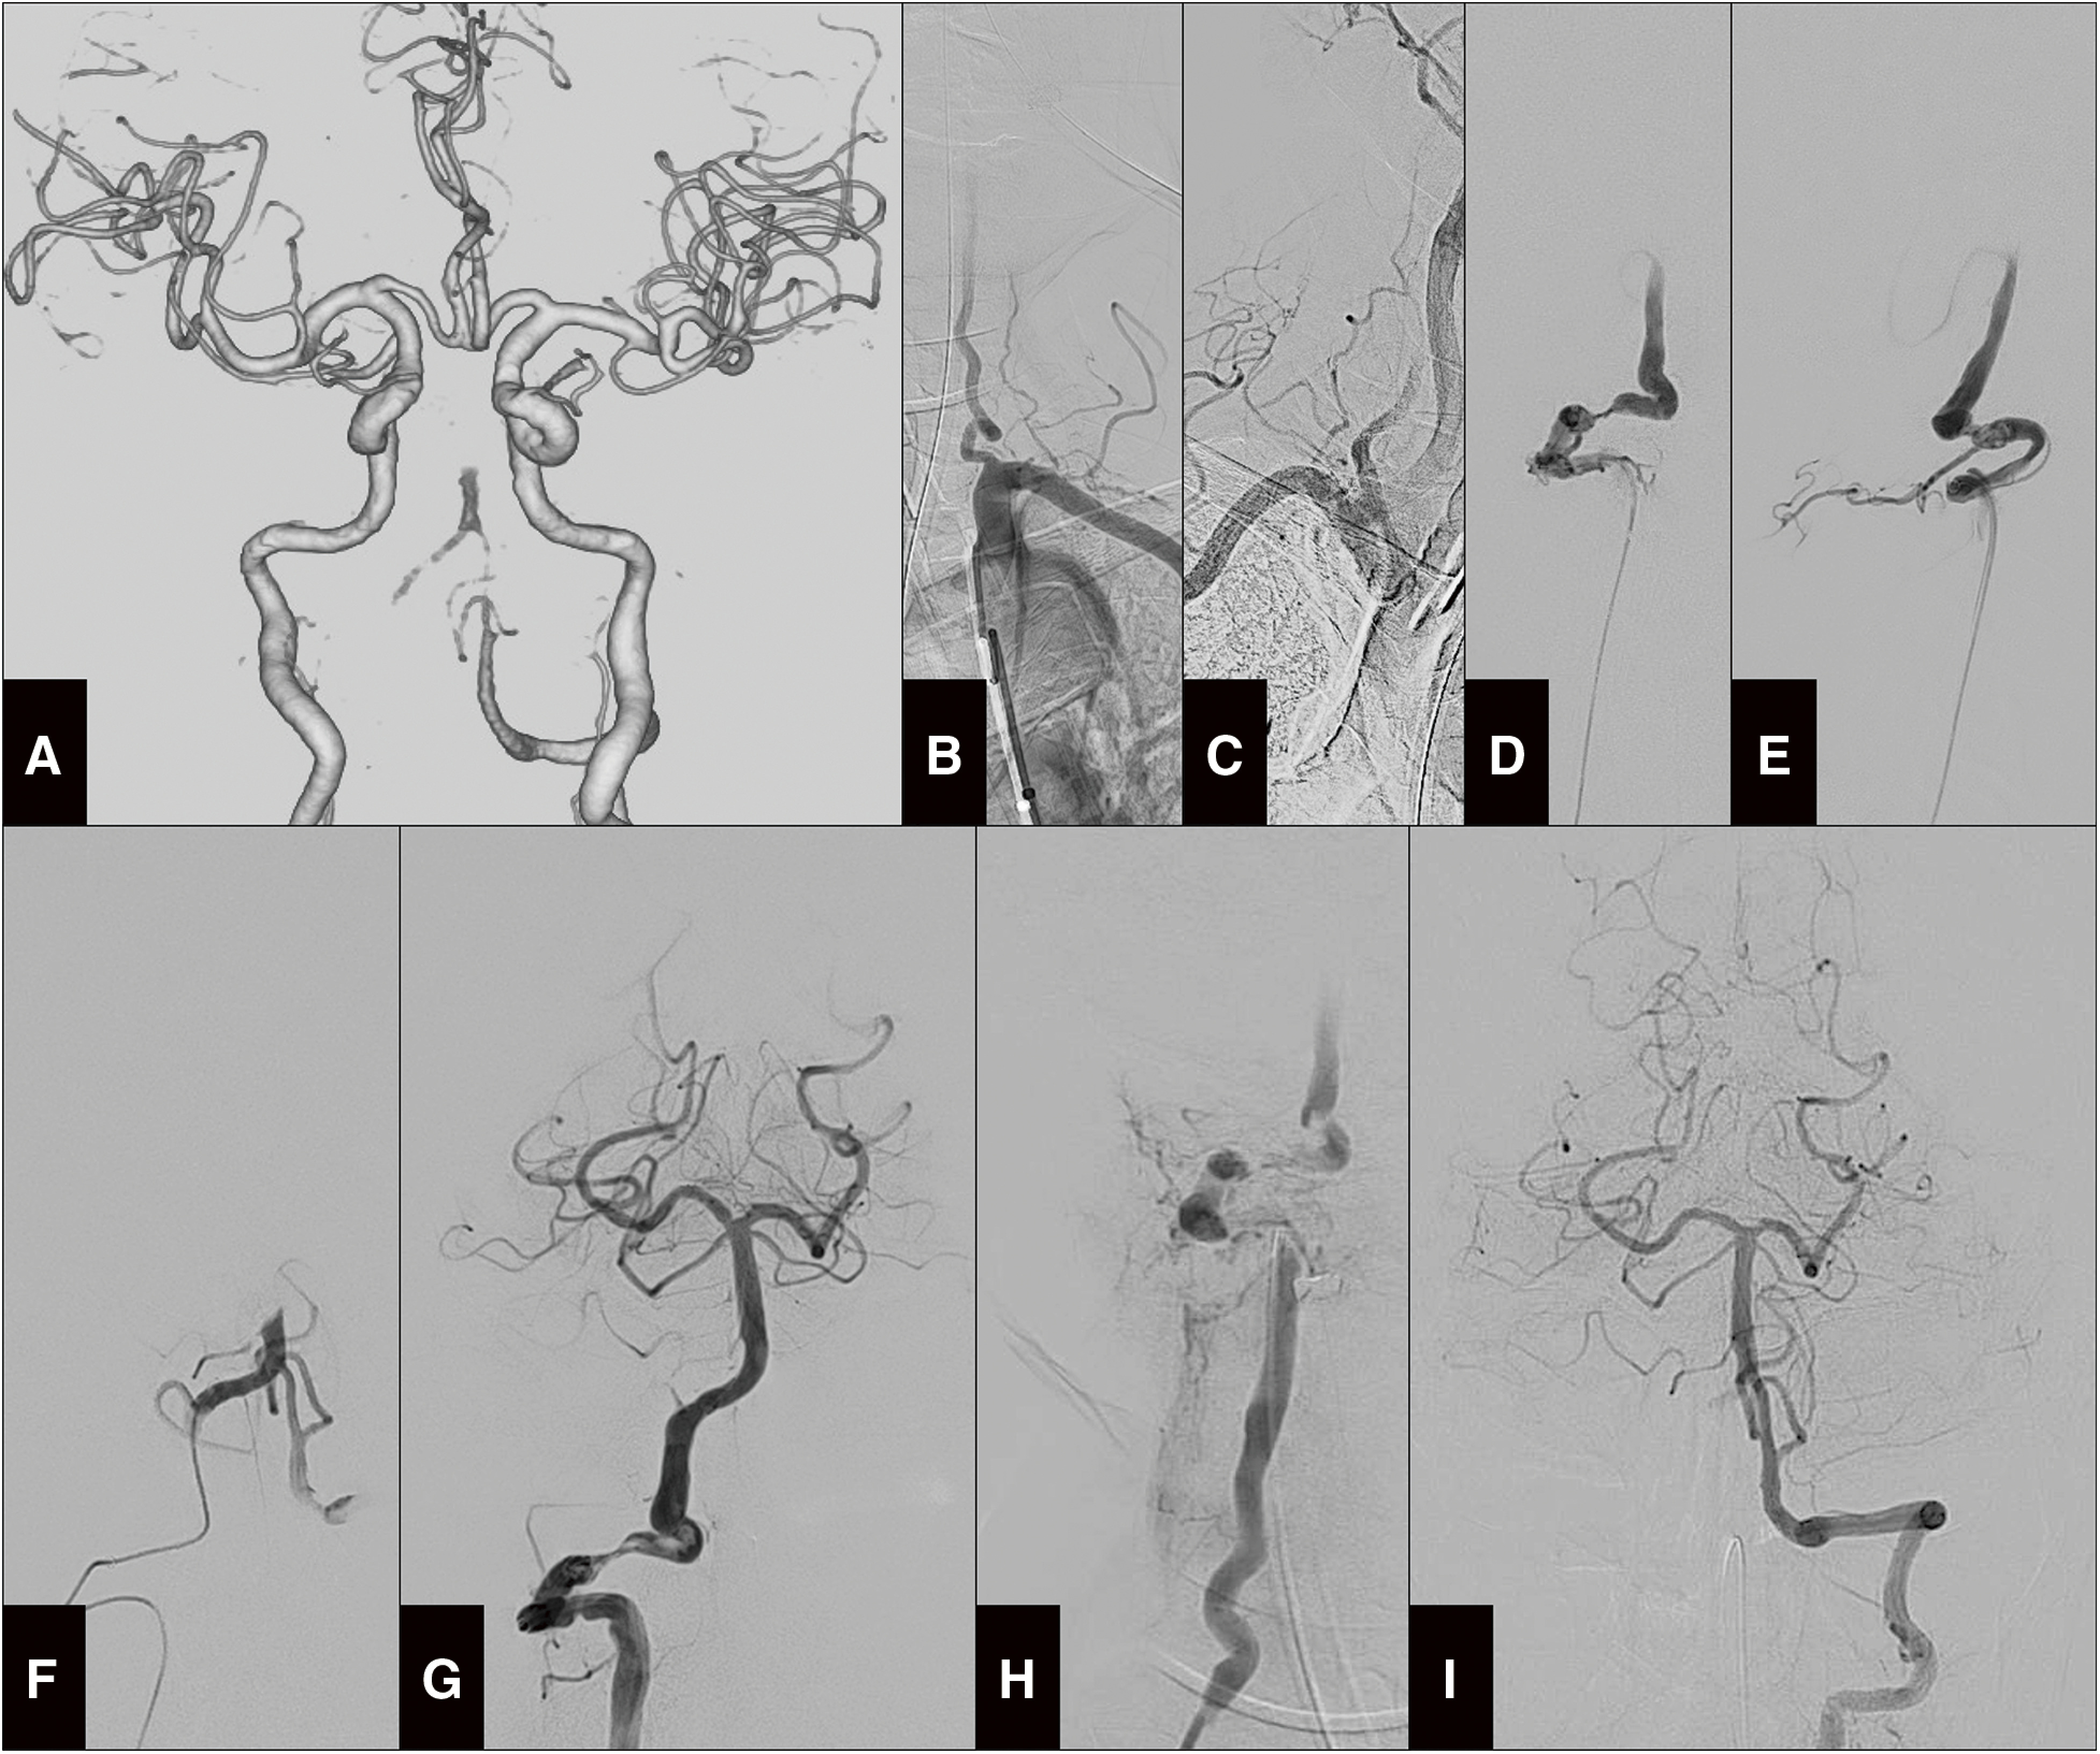
Fig. 2. Angiography images on the second day of hospitalization. (A) 3D-CTA performed upon worsening showing no blood flow on the basilar top and right proximal VA. (B) Preoperative left subclavian angiography indicating a vending VA origin. (C) Preoperative brachiocephalic angiography depicting a slow flow in the right VA. (D–E) Right vertebral angiography on anteroposterior (D) and lateral views (E) demonstrating VA dissection at the V3 segment. (F) Selective angiography distal to the dissection demonstrating BAO. (G) Microcatheter basilar angiography showing complete reperfusion. (H) Microcatheter right vertebral angiography at the lower V2 segment showing stagnating flow after balloon percutaneous transluminal angioplasty. (I) Left vertebral angiography depicting normal basilar perfusion.

