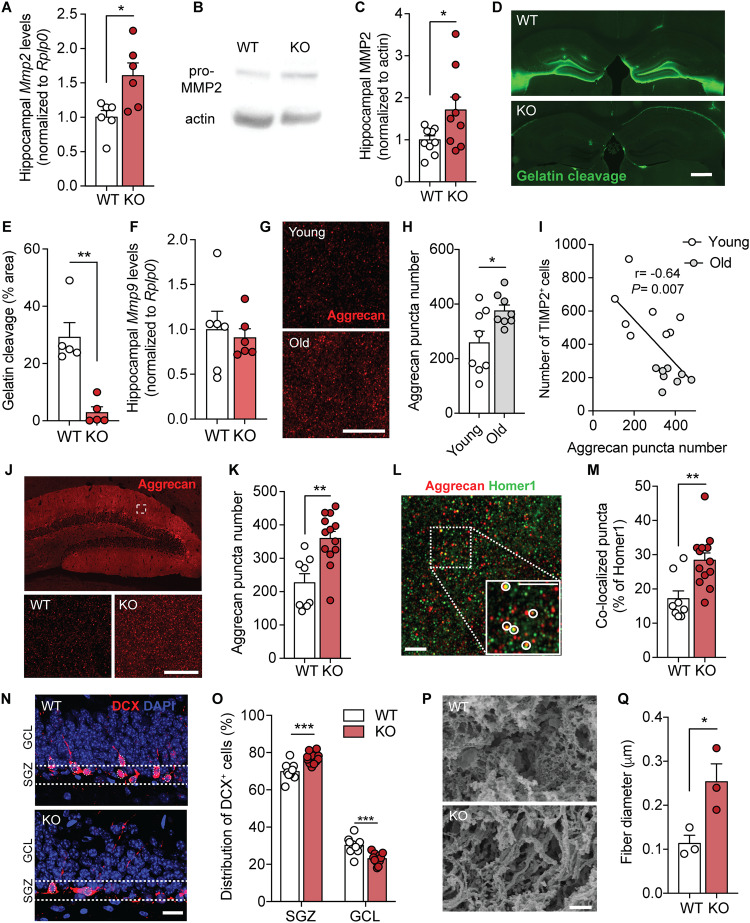
Fig. 5. TIMP2 ablation leads to accumulation of ECM within the hippocampus.
A Mmp2 mRNA levels by qPCR from isolated hippocampus of WT and TIMP2 KO mice (2–3 months of age, N = 6 mice per group). B Immunoblotting of MMP2 from hippocampal lysates of WT and TIMP2 KO mice (2–3 months of age, N = 9 mice per group) with corresponding (C) quantification of MMP2 protein levels. D Representative images of fluorescence following DQ gelatin injection into 5-month-old WT and TIMP2 KO hippocampus with corresponding (E) quantification of fluorescence in hippocampus as percentage area (N = 5 mice per group; scale bar, 500 μm). F Mmp9 mRNA levels by qPCR from isolated hippocampus of WT and TIMP2 KO mice (2–3 months of age, N = 6 mice per group). G Representative confocal microscopy images of aggrecan puncta in the molecular layer of the DG from young (3-month-old) and old (21-month-old) mice (N = 8 mice per group; scale bar, 5 μm), with corresponding (H) quantification of aggrecan puncta number. I Scatterplot of TIMP2+ cell number and aggrecan levels in young (3-month-old) and old (21-month-old) hippocampus. (N = 8 mice per group; Pearson correlation coefficient (r) = −0.64, P = 0.007). J Representative confocal microscopy images showing aggrecan puncta in the molecular layer of DG at low-magnification (top) and high-magnification (bottom) of analysis inset from WT and TIMP2 KO mice (2–3 months of age, N = 8–13 mice per group; scale bar, 5 μm) with corresponding (K) quantification of puncta. L Representative confocal microscopy image indicating colocalized puncta (see inset) with corresponding (M) quantification of aggrecan and homer1 co-localization in the molecular layer of DG from WT and TIMP2 KO mice (2–3 months of age, N = 8–13 mice per group; scale bar, 2.5 μm). N Representative images showing the migration of DCX+ cells in the SGZ and GCL of WT and TIMP2 KO mice (2–3 months of age, N = 11–12 mice per group, scale bar, 20 μm with corresponding (O) quantification of DCX+ cells distributed in the subgranular zone (SGZ) and granule cell layer (GCL) of DG. P Representative surface scanning electron microscopy (SEM) from DG of WT and TIMP2 KO mice (2–3 months of age, N = 3 mice per group, scale bar, 2 μm, with corresponding (Q) quantification of ECM microarchitecture in terms of fiber diameter measurements. Data are represented as mean ± SEM. Student’s t test for two-group comparisons. *P < 0.05, ** P < 0.01, ***P < 0.001. Data points represent individual mice.

