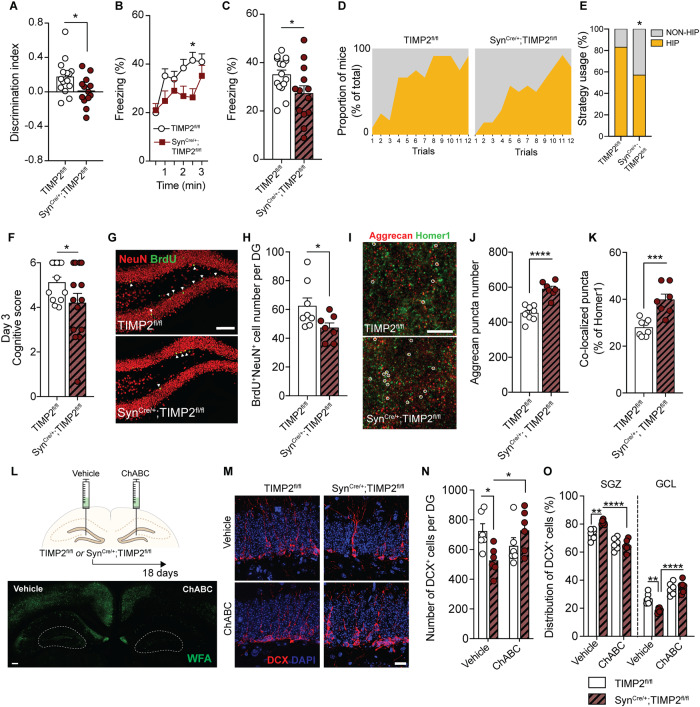
Fig. 6. Neuronal TIMP2 regulates hippocampus-dependent cognitive function and adult neurogenesis.
A Discrimination index for novel location recognition on day 2 and (B, C) contextual fear-conditioning freezing levels in TIMP2fl/fl and SynCre/+; TIMP2fl/fl mice (2–3 months of age, N = 13–15 mice per group). D Proportion of mice of each genotype using non-hippocampus-dependent (gray) and hippocampus-dependent (yellow) search strategies during the testing trials of TIMP2fl/fl and SynCre/+; TIMP2fl/fl mice in Barnes maze (2–3 months of age, N = 12–14 mice per group) with (E) quantification of the percentage of mice using these strategies on day 3. F Cognitive complexity scores for TIMP2fl/fl and SynCre/+; TIMP2fl/fl mice based on strategies used on day 3 of Barnes maze. G Representative confocal microscopy images of BrdU+ and NeuN+ cells in DG of TIMP2fl/fl and SynCre/+; TIMP2fl/fl mice (2–3 months of age, N = 7–8 mice per group, scale bar, 100 μm) with corresponding (H) quantification of BrdU+ NeuN+ newborn neurons in the DG. I Representative confocal microscopy images of aggrecan and homer1 puncta in molecular layer of DG of TIMP2fl/fl and SynCre/+; TIMP2fl/fl mice (N = 7–8 mice per group, scale bar, 5 μm) with corresponding (J) quantification of aggrecan puncta and (K) co-localized puncta of aggrecan and homer1, as indicated by overlaid circles. L Schematic depicting ChABC injection paradigm with representative WFA staining following ChABC digestion in DG; scale bar, 50 μm. M Representative confocal microscopy images of DCX+ cells in DG of TIMP2fl/fl and SynCre/+; TIMP2fl/fl mice injected with ChABC or vehicle (2–3 months of age, N = 6 mice per group; scale bar, 20 μm) with corresponding quantification of (N) number of DCX+ immature neuroblasts and (O) proportion of DCX+ cells in SGZ or GCL in DG of TIMP2fl/fl and SynCre/+; TIMP2fl/fl mice. Data are represented as mean ± SEM. Student’s t test for two-group comparisons in (A–C), (H), and (J, K), chi-square test in (E), nested t-test (F) with trial and mice as levels, and 2-way RM-ANOVA, Sidak’s post-hoc test in (N, O). *P < 0.05, ** P < 0.01, ***P < 0.001, ****P < 0.0001. Data points represent individual mice.

