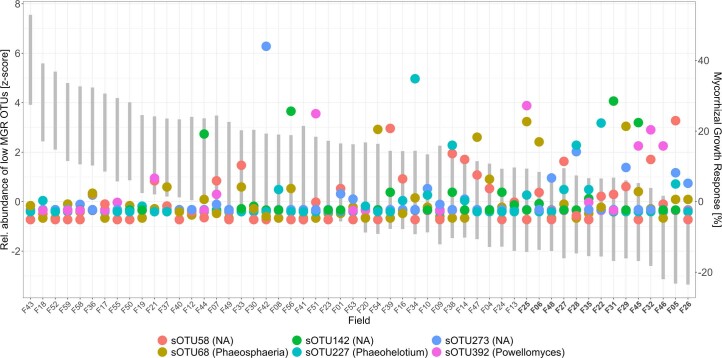
Extended Data Fig. 4. Relative abundance of sOTUs associated with low MGR across fields.
The relative abundance of OTUs was standardised using z-transformation for better visualization (primary y-axis). MGR is displayed in grey bars on the secondary y-axis and fields are arranged in descending order of MGR. The plot shows that on average only one or two of these OTUs were abundant in a field with low MGR. Full information on taxa identities can be found in Supplementary Table 10.

