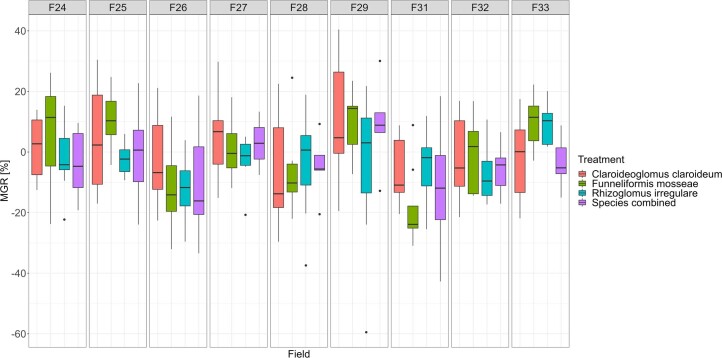
Extended Data Fig. 10. Inoculation trial with different AMF species.
Individual and combined inoculations of different AMF species did not result in any significant differences in MGR between species (p = 0.2006, F = 1.51) or significant interactions between fields and different species (p = 0.4124, F = 1.04,), as revealed by a 2-wy ANOVA (n = 8 individual plots per treatment group). The boxes represent the interquartile range (IQR, 25th to 75th percentile). The horizontal line within the box represents the median (50th percentile). The whiskers represent the minima and maxima of the data in comparison to the IQR (±1.5*IQR). Outliers are represented as individual data points.

