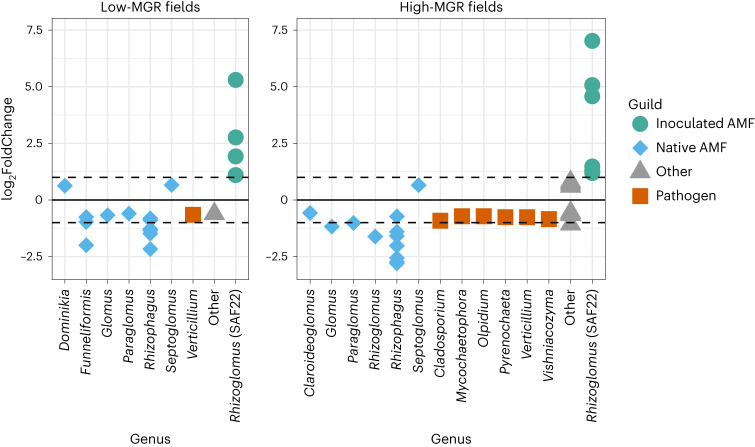
Fig. 6. Comparison of differentially abundant rOTUs between control and inoculated samples for fields with low and high MGR.
Differential abundances were assessed using DESeq2 (Wald test; significance threshold, 0.1; P values adjusted for multiple comparison; dashed lines correspond to a log2FC of −1 and 1 to guide the eye). In fields with low MGR (left), the inoculated R. irregulare SAF22 (represented by several OTUs corresponding to rRNA variants, see Methods) replaced the native AMF, while in fields with high MGR (right), not only the native AMF but also pathogenic fungi were replaced. Full taxonomic assignments of the OTUs can be found in Supplementary Tables 14 and 15. It should be noted that primers targeting AMF were used for the root data, so a number of fungi could not be detected, including some pathogens (for example, Fusarium, Myrothecium) that had been identified as significant in the soil data. Of note, we identified Trichosporon, the most important soil fungal OTU in the predictive model, also in the data of the root fungal communities (rOTU20 shares 100% sequence similarity with sOTU18 over its entire amplicon length). Even though it does not appear in the plot of fields with high MGR as it was below the significant threshold (P = 0.252), it showed a similar trend (log2FoldChange = −0.583) as the displayed pathogens (Supplementary Table 15).

