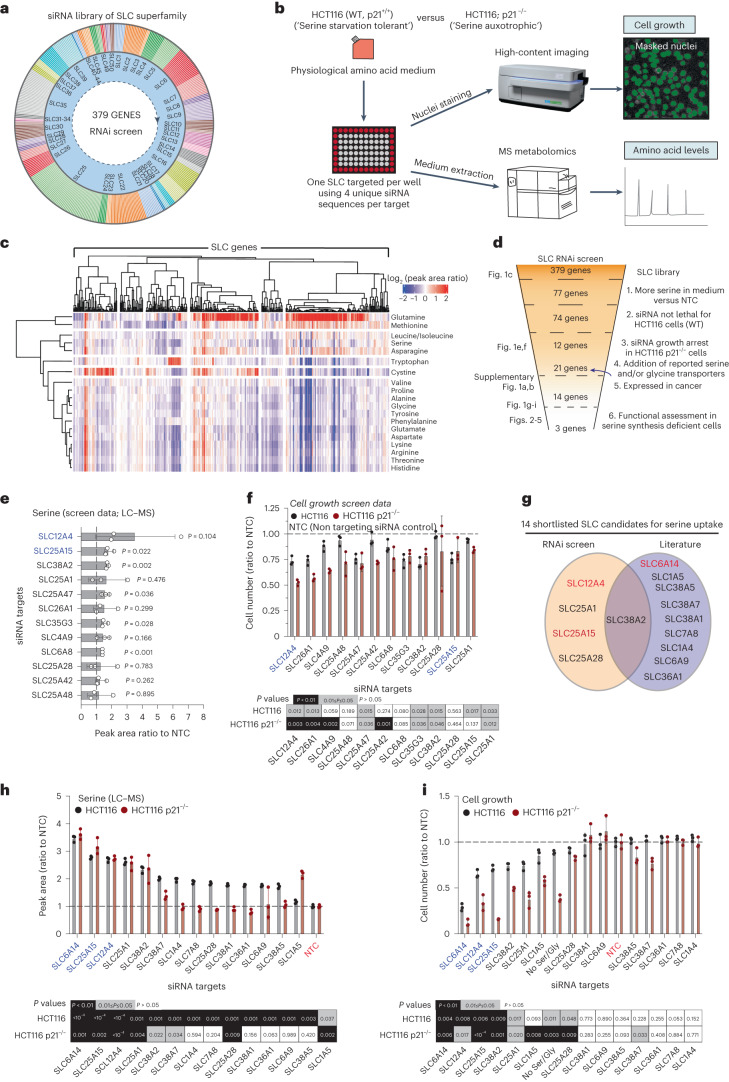
Fig. 1. Phenotypic landscape of SLC superfamily reveals SLCs influencing serine uptake in cancer cells.
a, Schematic of SLC RNAi library. b, Schematic of high-throughput imaging/LC-MS metabolomics strategy. WT, wild-type. c, Heat map showing amino acid usage of HCT116 cells upon knockdown of SLC-encoding genes. Values are log2 (peak area ratio to NTC). Heat map columns and rows are clustered based on Pearson’s correlation distance method. d, Strategy for hit selection and shortlisting. e, Serine levels in medium of HCT116 cells upon knockdown of SLC-encoding genes. Values are mean ± s.d. of peak area ratio to NTC and adjusted for cell number. f, Cell number (ratio to NTC) of HCT116 and HCT116 p21−/− cells upon knockdown of SLC-encoding genes after 72 h of growth. Values are mean ± s.d. Heat map indicating P values for each condition compared to NTC (control) (bottom). g, Plot showing serine uptake SLC candidates selected for further investigation. h, Serine levels in medium of HCT116 and HCT116 p21−/− cells upon knockdown of SLC-encoding genes using a deconvoluted siRNA for each gene. Values are peak area ratio to NTC and adjusted for cell number. Bar plots show mean ± s.d. Heat map indicating P values for each condition compared to NTC (control) (bottom). i, Cell number (ratio to NTC) of HCT116 and HCT116 p21−/− cells upon knockdown of SLC-encoding genes using a deconvoluted siRNA for each gene, after 72 h of growth. Values are mean ± s.d. Heat map indicating P values for each condition compared to NTC (control) (bottom). Data are n = 3 biological replicates from individual experiments (c,e,f,h,i). Statistical significance was assessed by two-tailed one-sample t-test on natural log-transformed values (e,f,h,i).

