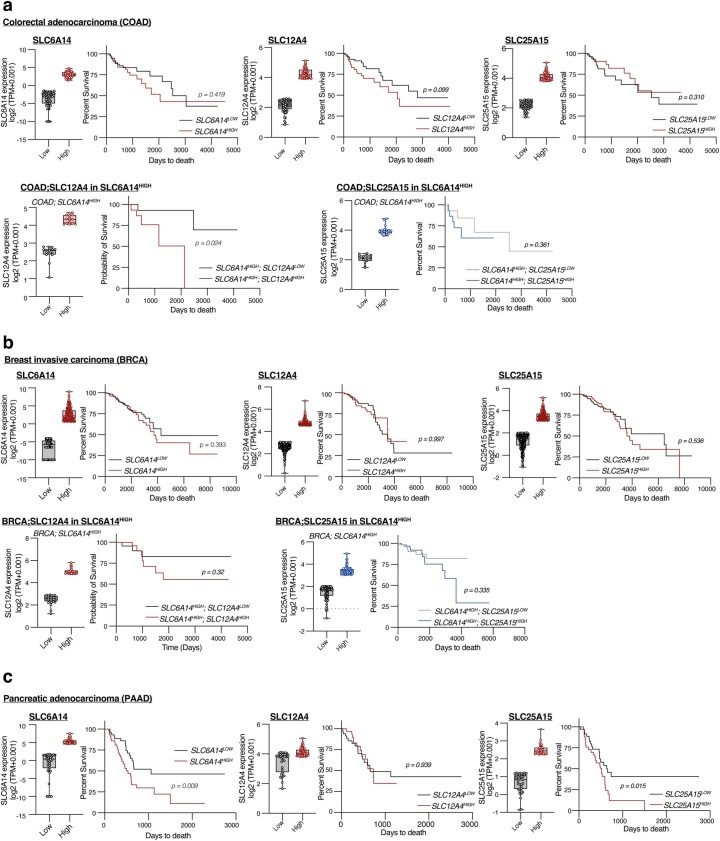
Extended Data Fig. 7. Assessment of the prognostic value of SLC6A14, SLC25A15 and SLC12A4 in cancer patients.
a. Colon adenocarcinoma (COAD) TCGA dataset: TOP; Prognostic value for overall survival of SLC6A14 transcript levels comparing samples with 25% lowest (SLC6A14LOW) (n = 57) and 25% highest (SLC6A14HIGH) (n = 80) expression (left), of SLC12A4 comparing samples with 20% lowest (SLC12A4LOW) (n = 58) and 20% highest (SLC12A4HIGH) (n = 58) expression (middle) and of SLC25A15 comparing samples with 20% lowest (SLC25A15LOW) (n = 58) and 20% highest (SLC25A15HIGH) (n = 58) expression (right). Bottom; Prognostic value for overall survival of SLC12A4 transcript levels in SLC6A14HIGH COAD patients with 20% lowest (SLC6A14HIGH;SLC12A4LOW) (n = 15) and 20% highest (SLC6A14HIGH;SLC12A4HIGH) (n = 15) expression (left) and of SLC25A15 in SLC6A14HIGH COAD patients with 20% lowest (SLC6A14HIGH;SLC25A15LOW) (n = 15) and 20% highest (SLC6A14HIGH;SLC25A15HIGH) (n = 15) expression (right). b. Breast invasive carcinoma (BRCA) TCGA dataset: TOP; Prognostic value for overall survival of SLC6A14 transcript levels comparing samples with 25% lowest (SLC6A14LOW) (n = 277) and 25% highest (SLC6A14HIGH) (n = 273) expression (left), of SLC12A4 comparing samples with 15% lowest (SLC12A4LOW) (n = 164) and 15% highest (SLC12A4HIGH) (n = 164) expression (middle) and of SLC25A15 comparing samples with 25% lowest (SLC25A15LOW) (n = 276) and 25% highest (SLC25A15HIGH) (n = 273) expression (right). Bottom; Prognostic value for overall survival of SLC12A4 transcript levels in SLC6A14HIGH BRCA patients with 10% lowest (SLC6A14HIGH;SLC12A4LOW) (n = 28) and 10% highest (SLC6A14HIGH;SLC12A4HIGH) (n = 30) expression (left) and of SLC25A15 in SLC6A14HIGH BRCA patients with 25% lowest (SLC6A14HIGH;SLC25A15LOW) (n = 70) and 25% highest (SLC6A14HIGH;SLC25A15HIGH) (n = 69) expression (right). c. Pancreatic adenocarcinoma (PAAD) TCGA dataset: TOP; Prognostic value for overall survival of SLC6A14 transcript levels comparing samples with 25% lowest (SLC6A14LOW) (n = 45) and 25% highest (SLC6A14HIGH) (n = 45) expression (left), of SLC12A4 comparing samples with 20% lowest (SLC12A4LOW) (n = 36) and 20% highest (SLC12A4HIGH) (n = 36) expression (middle) and of SLC25A15 comparing samples with 20% lowest (SLC25A15LOW) (n = 37) and 20% highest (SLC25A15HIGH) (n = 40) expression (right). In a-c: Box and whiskers plots are log2 (TPM + 0.001) with boxes representing median and 25th and 75th percentiles and whiskers extending from the smallest to the highest value of the data with individual dots showing each point of the dataset. Kaplan–Meier curves were statistically compared using log-rank (Mantel−Cox) test.

