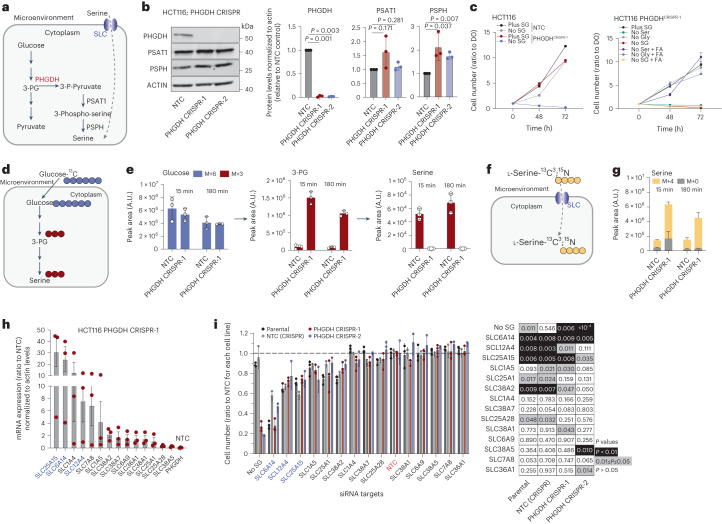
Fig. 2. Serine synthesis-deficient cells depend on SLC-mediated serine uptake.
a, Schematic of serine synthesis pathway. b, Immunoblots of PHGDH, PSAT1, PSPH and ACTIN (loading control) in control (NTC) or PHGDH-depleted HCT116 cells (left). Blots are representative of three independent experiments. Densitometric quantification of protein (right). Values are mean ± s.d. from n = 3 independent experiments. Statistical significance assessed by two-tailed one-sample t-test on natural log-transformed values. c, Growth curves of HCT116 NTC (control) or PHGDH-depleted cells in medium ± SG (left). SG, serine and glycine. Growth curves of HCT116 PHGDH-depleted cells in medium ± serine and/or glycine ± formic acid (FA) (right). Values are mean ± s.e.m. from n = 3 biological replicates and relative to t = 0 (D0). d, Schematic of [U-13C6]d-glucose administration to monitor serine synthesis. e, Incorporation of glucose-derived, labeled carbons into 3-phosphoglycerate (3-PG) and serine in HCT116 NTC (control) or PHGDH-depleted cells following 15 min and 180 min incubation in medium supplemented with [U-13C6]d-glucose. Values are mean ± s.d. from n = 3 biological replicates. f, Schematic of [13C3,15N]l-serine administration to monitor serine uptake. g, Serine levels in HCT116 NTC (control) or PHGDH-depleted cells showing [13C3,15N]l-serine-derived labeled carbon and nitrogen incorporation following 15 min and 180 min incubation in medium supplemented with [13C3,15N]l-serine. Values are mean ± s.d. from n = 3 biological replicates. h, Messenger RNA expression levels of indicated SLC-encoding genes in HCT116 PHGDH-depleted cells versus HCT116 NTC control. Values are mean ± s.e.m. from n = 3 independent experiments. i, Cell number (ratio to NTC) of HCT116 parental, NTC (CRISPR control) and two PHGDH-depleted cell lines upon knockdown of indicated SLC-encoding genes, after 72 h of growth (left). Values are mean ± s.d. from n = 3 biological replicates. Heat map indicating P values for each condition compared to NTC (control) (right). Statistical significance was assessed by two-tailed one-sample t-test on natural log-transformed values.

