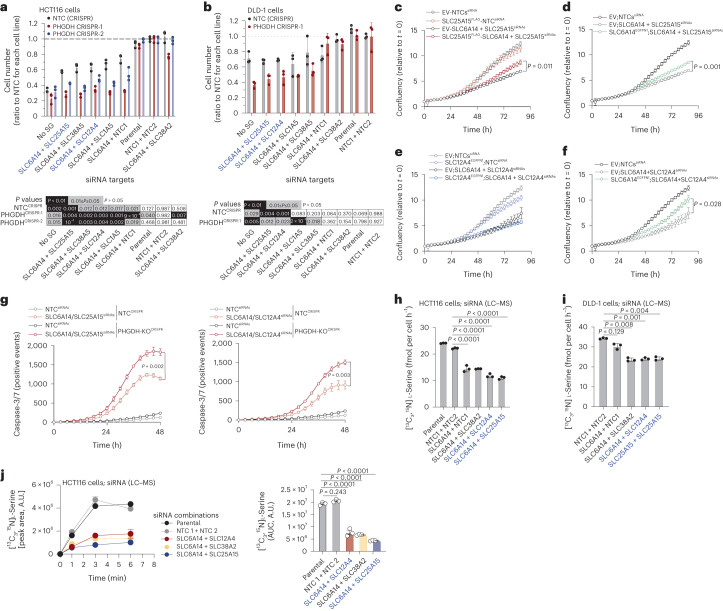
Fig. 6. Synthetic lethality between paired serine transporter silencing and PHGDH loss.
a, Cell number (ratio to NTC) of HCT116 NTC (CRISPR control) and two PHGDH-depleted cell lines upon double knockdown of SLC6A14 and indicated SLC-encoding genes, after 72 h of growth (top). Values are mean ± s.d. from n = 3 biological replicates. Statistical significance was assessed by two-tailed one-sample t-test on natural log-transformed values. Heat map indicating P values for each condition compared to NTC (control) (bottom). b, Cell number (ratio to NTC) of DLD-1 NTC (CRISPR control) and PHGDH-depleted cells upon double knockdown of SLC6A14 and indicated SLC-encoding genes, after 72 h of growth (top). Values are mean ± s.d. from n = 3 biological replicates. Statistical significance was assessed by two-tailed one-sample t-test on natural log-transformed values. Heat map indicating P values for each condition compared to NTC (control) (bottom). c, Growth curves of HCT116 cells expressing EV (control) or FLAG-tagged SLC25A15 with NTCs (siRNA, control) or silenced for SLC6A14 and SLC25A15. Values are mean ± s.d. from n = 3 biological replicates and representative of three independent experiments. Statistical significance assessed by two-tailed Welch’s t-test at t = 87 h time point. d, Growth curves of HCT116 cells expressing EV (control) or GFP-tagged SLC6A14 with NTCs (siRNA, control) or silenced for SLC6A14 and SLC25A15. Values are mean ± s.d. from n = 3 biological replicates and representative of three independent experiments. Statistical significance assessed by two-tailed Welch’s t-test at t = 87 h time point. e, Growth curves of HCT116 cells expressing EV (control) or GFP-tagged SLC12A4 with NTCs (siRNA, control) or silenced for SLC6A14 and SLC12A4. Values are mean ± s.d. from n = 3 biological replicates and representative of three independent experiments. Control data (EV-NTCssiRNA) is replicated in c,d. f, Growth curves of HCT116 cells expressing EV (control) or GFP-tagged SLC6A14 with NTCs (siRNA, control) or silenced for SLC6A14 and SLC12A4. Values are mean ± s.d. from n = 3 biological replicates and representative of three independent experiments. Statistical significance assessed by two-tailed Welch’s t-test at t = 87 h time point. Control data (EV-NTCssiRNA) is replicated in (c), (d) and (e). g, Caspase-3/-7-positive events over time of HCT116 NTC (CRISPR control) and PHGDH-depleted cells with NTCs (siRNA, control) or double-silenced for SLC6A14 / SLC25A15 (top) and SLC6A14 / SLC12A4 (bottom). Values are mean ± s.d. from n = 3 biological replicates and representative of three independent experiments. Statistical significance assessed by two-tailed Welch’s t-test at t = 48 h time point. h, The [13C3,15N]l-serine consumption in HCT116 cells silenced for SLC6A14 and indicated SLC-encoding genes. Values are mean ± s.d. from n = 3 biological replicates. i, [13C3,15N]l-Serine consumption in DLD-1 cells silenced for SLC6A14 and indicated SLC-encoding genes. Values are mean ± s.d. from n = 3 biological replicates. j, The [13C3,15N]l-serine uptake of HCT116 parental, ‘NTC1 and NTC2’ (siRNA control) and cells double-silenced for SLC6A14 and SLC12A4, SLC38A2 or SLC25A15 (left). Values are mean ± s.e.m. from n = 3 biological replicates. AUC of [13C3,15N]l-serine uptake curves from left (right). Values are mean ± s.e.m. from n = 3 biological replicates. Statistical significance was assessed with ordinary one-way ANOVA and Dunnett’s multiple comparisons test (h–j).

