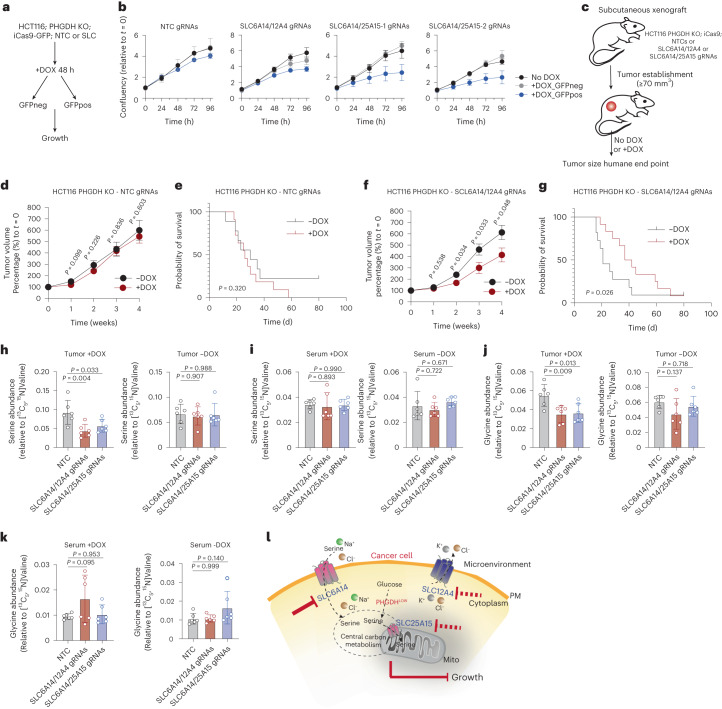
Fig. 7. Paired targeting of serine transporters and PHGDH loss impacts colorectal cancer cell growth in vivo.
a, Schematic of FACS sorting strategy from DOX-inducible iCas9-GFP; PHGDH-depleted HCT116 cells expressing either a combination of NTCs, SLC6A14/12A4 or SLC6A14/25A15 gRNAs. b, Growth curves of cells from a. Data are mean ± s.d. from n = 3 biological replicates per condition for each time point. c, Schematic of in vivo experiments. d, Tumor volume over time of tumors from PHGDH-depleted HCT116 cells expressing NTC gRNAs ±DOX. Values are mean ± s.e.m. from n = 9 −DOX and n = 11 +DOX mice. e, Kaplan–Meier plot showing probability of survival on mice from d. f, Tumor volume over time of tumors from PHGDH-depleted HCT116 cells expressing SLC6A14/12A4 gRNAs ±DOX. Values are mean ± s.e.m. from n = 11 −DOX and n = 12 +DOX treated mice. g, Kaplan–Meier plot showing probability of survival on mice from f. h, Serine levels in tumors formed by PHGDH-depleted HCT116 cells expressing NTC, SLC6A14/SLC12A4 or SLC6A14/SLC25A15 gRNAs with (left) or without (right) DOX induction. Values are mean ± s.d. from n = 6 mice per condition. i, Serine levels in circulating blood serum of mice with tumors formed by PHGDH-depleted HCT116 cells expressing NTC, SLC6A14/SLC12A4 or SLC6A14/SLC25A15 gRNAs with (left) or without (right) DOX induction. Values are mean ± s.d. from n = 6 mice per condition. j, Glycine levels in tumors formed by PHGDH-depleted HCT116 cells expressing NTC, SLC6A14/SLC12A4 or SLC6A14/SLC25A15 gRNAs with (left) or without (right) DOX induction. Values are mean ± s.d. from n = 6 mice per condition. k, Glycine levels in circulating blood serum of mice with tumors formed by PHGDH-depleted HCT116 cells expressing NTC, SLC6A14/SLC12A4 or SLC6A14/SLC25A15 gRNAs with (left) or without (right) DOX induction. Values are mean ± s.d. from n = 6 mice per condition. l, Schematic summary. Statistical significance was assessed with two-tailed unpaired t-test (d,f), two-tailed Gehan–Breslow–Wilcoxon test (e,g) and ordinary ANOVA and Dunnett’s multiple comparisons test (h–k).

