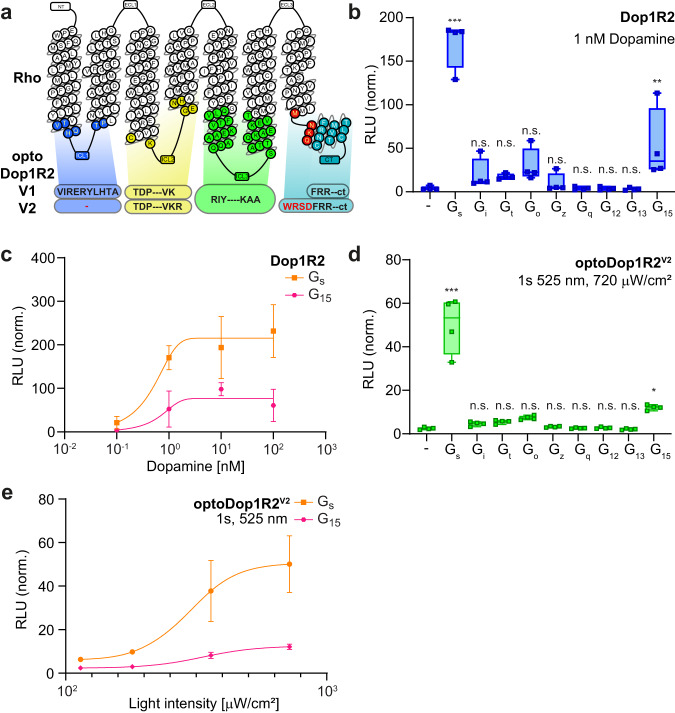
Fig. 2. Design and characterization of optoDop1R2V2.
a Schematic overview of optoDop1R2V2 design compared to V1. b G protein-coupling properties of Drosophila Dop1R2 with 1nM dopamine. Maximum normalized responses are shown as relative light units (RLU, n = 4, **p < 0.01, ***p < 0.001, one-way ANOVA with Dunnett’s post hoc test). c DA concentration dependent maximum activation of Gs and G15 signaling of Dop1R2 (mean ± SEM, 0.1/10 nM: n = 3; 1.0/100 nM: n = 4). d G protein-coupling properties of optoDop1R2V2 after activation with light (1 s, 525 nm, 720 μW/cm2). Maximum normalized responses are shown as relative light units (RLU, n = 4, *p < 0.05, ***p < 0.001, one-way ANOVA with Dunnett’s post hoc test). e Light intensiy-dependent maximum of Gs and G15 signaling induced by optoDop1R2V2 (1 s, 525 nm, mean ± SEM, n = 4). All n indicate the number of independent experiments. All boxplots depict 75th (top), median (central line) and 25th (bottom) percentile, whiskers depict 99th (top) and 1st (bottom) percentile. Source data and statistical details are provided as a Source Data file.

