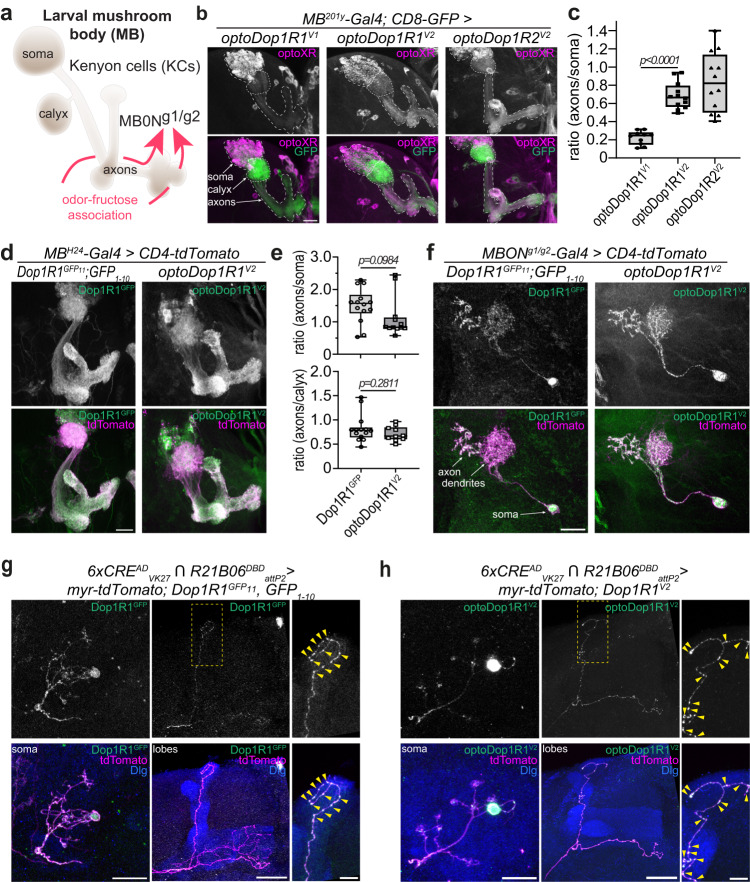
Fig. 3. In vivo localization of optoDopRs and endogenous Dop1R1.
a Schematic model of the larval mushroom body consisting of Kenyon cells (KCs) receiving input from dopaminergic neurons and connecting to output neurons (MBONs). Odor-Fructose association and learning require dopaminergic input and MBONg1/g2 (adapted from ref. 56). b Immunohistochemistry of optoXRs (anti-Rho labeling) expression in KCs (labeled with CD8-GFP) in the larval mushroom body. Localization of KC somata, calyx (dendrites) and axons are outlined (scale bar: 25 μm). c Quantification of the optoDopR signal intensity ratios of axons/soma (n = 10, 12, 12 samples from 5, 6, 6 biologically independent animals, respectively, unpaired two-tailed Student’s t-test). d Expression of endogenous Dop1R1 and optoDop1R1V2 in the larval mushroom body (scale bars: 25 μm). e Quantification of the Dop1R1 and optoDop1R1 signal intensity ratios of axons/soma and axons/calyx. (n = 14, 10 samples from 7, 5 biologically independent animals, respectively, unpaired two-tailed Student’s t-test). f Labeling of endogenous GFP-tagged Dop1R1 and expression of optoDop1R1V2 (anti-Rho labeling) in MBONg1/g2. Axon terminals, dendrites and soma are indicated and co-labeled by CD4-tdTomato expression (representative image from two independent experiments with multiple samples). Scale bar: 20 µm. g Single-cell labeling of endogenous GFP-tagged Dop1R1 in adult KCs using activity-dependent induction of Gal4 activity52. Example of KC labeled with myristoylated(myr)-tdTomato and endogenous Dop1R1GFP (anti-GFP-labeled) in the somatodendritic region, axonal lobes and enlarged axon region (MB labeled by anti-Dlg). Presynaptic varicosities are indicated by arrowheads (representative images from two independent experiments with multiple samples). Scale bars: 10 µm, 20 µm, 5 µm. h Single-cell expression of optoDop1R1V2 in adult MB showing a labeled KC expressing myr-tdTomato and optoDop1R1V2 (anti-Rho labeled) displaying localization to the somatodendritic compartment, axonal lobes and enlarged axon region (MB labeled by anti-Dlg). Presynaptic varicosities are indicated by arrowheads (representative image from two independent experiments with multiple samples). Scale bars: 10 µm, 20 µm, 5 µm. All boxplots depict 75th (top), median (central line) and 25th (bottom) percentile, whiskers depict 99th (top) and 1st (bottom) percentile. Source data and statistical details are provided as a Source Data file.

