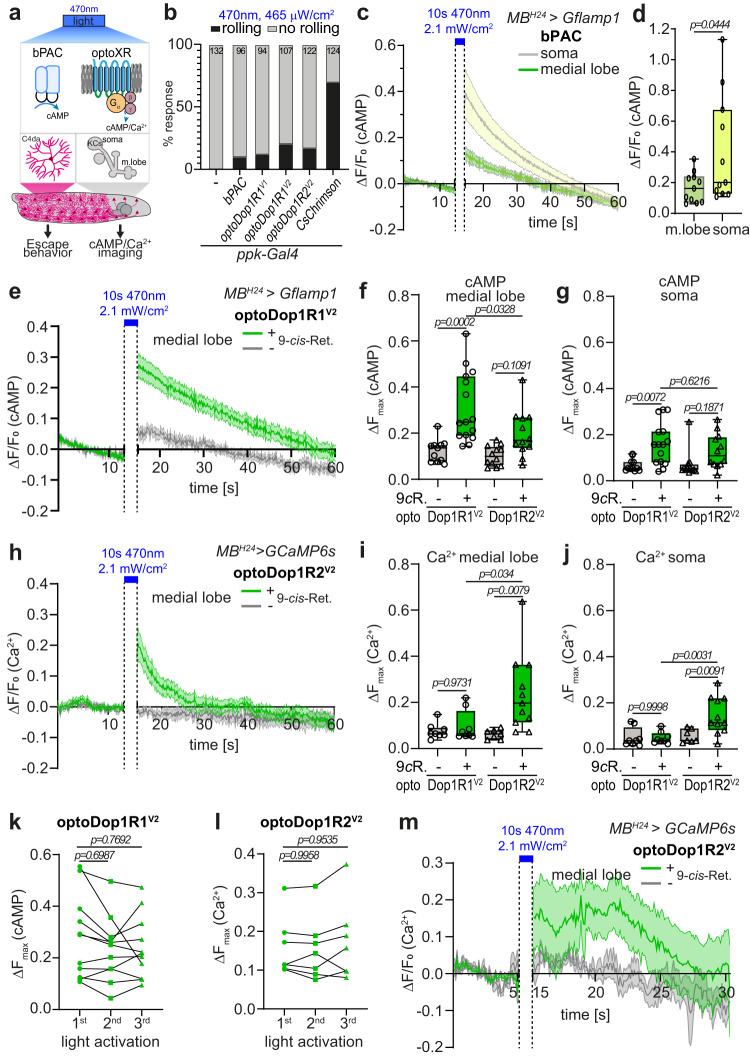
Fig. 4. In vivo characterization of optoDopR signaling activity.
a Schematic of of bPAC and optoXRs activation in larval nociceptors (C4da) or Kenyon cells (KCs). cAMP increase in C4da neurons elicits spontaneous larval escape responses. KC expression of GFlamp1 or GCaMP6s was used to image cAMP or Ca2+ responses, respectively. b Spontaneous escape responses (rolling) upon blue light illumination in larvae expressing bPAC, optoXRs, or CsChrimson in larval nociceptors (n animals as indicated). c cAMP responses over time in the larval mushroom body (soma and medial lobe) induced by bPAC activation (mean ± SEM, n = 11, 11 biologically independent samples). d Maximum cAMP responses in the KC soma and MB medial lobe after light-induced activation of bPAC (n = 11, 11 biologically independent samples, unpaired two-tailed Student’s t-test). e cAMP responses in the medial lobe after optoDop1R1V2 activation (mean ± SEM, n = 11, 15 biologically independent samples). f Maximum cAMP responses in the MB medial lobe after light-induced activation of optoDop1R1V2 and optoDop1R2V2 (n = 11, 15, 12, 12 biologically independent samples, one-way ANOVA with Tukey’s post hoc test). g Maximum cAMP responses in the KC soma region after light-induced activation of optoDop1R1V2 and optoDop1R2V2 (n = 11, 15, 12, 12 biologically independent samples, one-way ANOVA with Tukey’s post hoc test). h Calcium imaging in the larval mushroom body of isolated brains using GCaMP6s and optoDop1R2V2 with and without 9-cis-Retinal feeding (mean ± SEM, n = 7, 11 biologically independent samples). i Maximum calcium responses in the MB medial lobe after light-induced activation of optoDop1R1V2 and optoDop1R2V2 (n = 8, 8, 7, 11 biologically independent samples, one-way ANOVA with Tukey’s post hoc test). j Maximum calcium responses in the KC soma region after light-induced activation of optoDop1R1V2 and optoDop1R2V2 (n = 8, 8, 7, 11 biologically independent samples, one-way ANOVA with Tukey’s post hoc test). k Maximum cAMP responses in the MB medial lobe after repeated light-induced activation of optoDop1R1V2 (n = 9 biologically independent samples, one-way ANOVA with Tukey’s post hoc test). l Maximum calcium responses in the MB medial lobe after repeated light-induced activation of optoDop1R2V2 (n = 6 biologically independent samples, one-way ANOVA with Tukey’s post hoc test). m In vivo calcium imaging of the larval mushroom medial lobe using GCaMP6s and light-induced activation of optoDop1R2V2 in animals reared with or without 9-cis-retinal (mean ± SEM, n = 5, 5 animals). All boxplots depict 75th (top), median (central line) and 25th (bottom) percentile, whiskers depict 99th (top) and 1st (bottom) percentile. Source data and statistical details are provided as a Source Data file.

