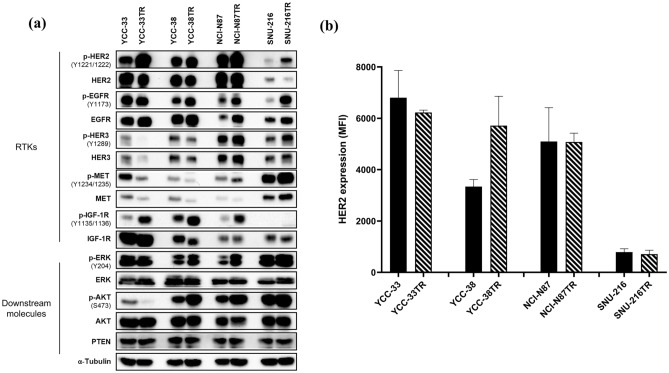
Figure 3.
Comparative molecular profiling of the parental and trastuzumab-resistant (TR) cell lines. (a) Immunoblot analysis of receptor tyrosine kinases (RTKs) and related downstream molecules. α-Tubulin was used as the loading control. The blots were cut prior to hybridization with antibodies. The uncropped version of the western blots is reported in Supplementary Fig. S2. (b) Cell surface expression of HER2 was determined by flow cytometry (mean fluorescence intensity, MFI). Error bars, SD.

