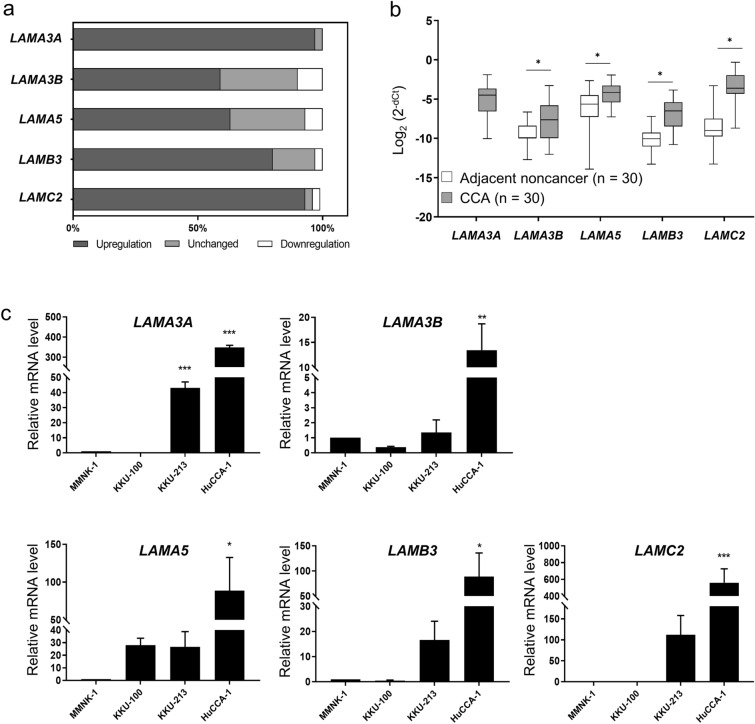
Figure 2.
Validation of the expression of laminin genes in CCA tissues and cell lines using real-time RT-PCR. Relative mRNA levels of LAMA3A, LAMA3B, LAMA5, LAMB3 and LAMC2 in 30 pairs of CCA and their matched adjacent noncancerous tissues and in CCA cell lines were accessed using qPCR analysis normalized to GAPDH, and 18s rRNA, respectively. (a) Percentage frequency of the cases with differential gene expression. Data were defined as upregulation and downregulation, according to FC ≥ 2 and FC ≤ 0.5, respectively. (b) The relative mRNA expression of CCA to their matched adjacent noncancerous tissues was evaluated using 2−dCt formula and statistically analysed with Wilcoxon matched-pairs signed rank. (c) Relative mRNA levels of CCA cell lines to that of immortalized cholangiocyte MMNK-1 cells. Bar represents mean ± SEM of three independent experiments. Figures were created using Graphpad Prism. *P < 0.05, **P < 0.01, ***P < 0.001.

