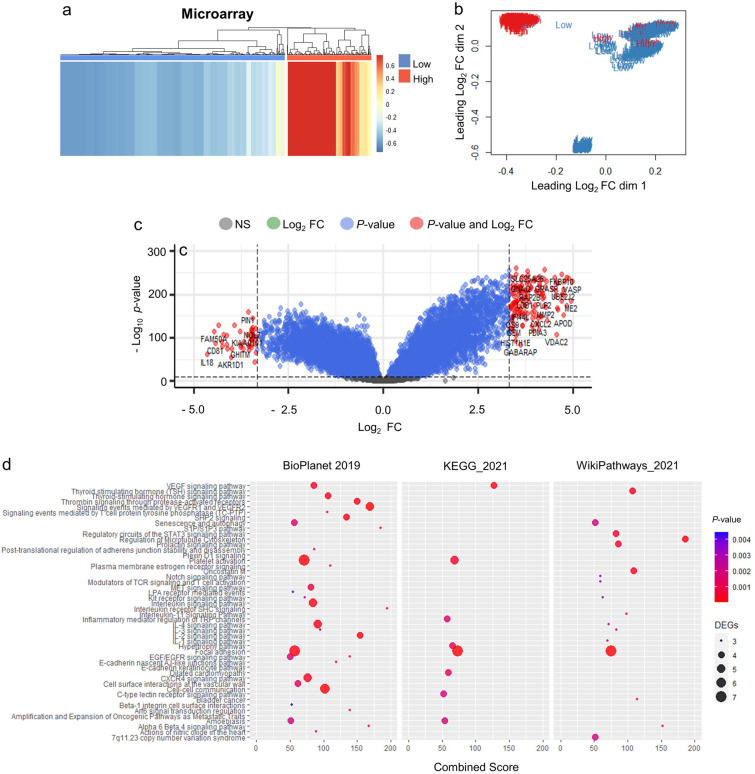
Figure 4.
The DEGs and pathway enrichment analysis acquired unsupervised hierarchical clustering of LAMA3 stratified CCA sample of microarray dataset. (a) Heatmap image and (b) PCA plot indicating the separation low and high LAMA3 expression. (c) DEGs in high vs low LAMA3 expression group. Statistically significant DEGs cut-off are with the adjusted P < 0.05 and the Log2 FC of 3.32. (d) Pathway enrichment analysis of DEGs using EnrichR consolidated databases: BioPlanet, KEGG and Wikipathways. DEGs were considered at FC > 2 and P < 0.05. Enriched pathway were considered when combined score > 50.

